Cartesian Coordinate Graph of Exponential Equation or Function:
Therefore, the x-intercept of the graph of x + y = 5 is +5. For a linear equation in the common form ax + by = c, the x-intercept and y-intercept can also be given in common form.
Any algebraic equation including two unknowns of any function associating two physical quantities can be plotted on a Cartesian coordinate graph. Linear equations/linear functions plot as straight lines on Cartesian coordinate graphs. For instance, x + y = 5 and f(x) = 3x + 9 plot as straight lines. Higher order equations/functions, like as quadratic equations or functions & exponential equations, can be plotted on Cartesian coordinate graphs. Figure shows the shape of the graph of a typical quadratic equation or function. This shape is known as a parabola. Figure shows the shape of the graph of a classical exponential equation or function.
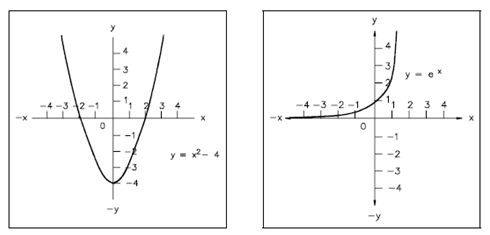
Figure: Cartesian Coordinate Graph of Exponential Equation or Function