Creating a Graph:
To build a simple Line graph for sales order transactions. The Graph earning for the year grouped through month.

The table definitions are as given below:
Table Name : radiant (Master)
Description : It is use for store information about employee's salary.
Table Name : Ray
Description : It is use for store information about projects.
The Solution:
1. Invoke Oracle Graphics Builder Tool. Whenever the Graphics Builder Tool is invoked, New display with a default name disp1 is created and opened in the Object Navigator window that is shown in the below diagram.
2. Connect to the database through clikcking on File and Connect. Creating a Query for the Graph:
1. From the Menu bar select Chart...Create Chart...because a graph is created using a query, a Chart Genie - New Query dialog box is displayed.
This dialog box involves two tab pages that are Query and Data. The Query tab involves query properties such as Query Type, Query Name.
Query Name: The default name provide to the newly created query is query0.
Query Type: The Query Type property determines the data source for a graph. Various options available for the Query Category are:
- SQL Statement
- SYLK File or a WKS File - These are spreadsheet file formats.
- PRN is a printer file.
- External SQL File.
The default Query Type is SQL Statement and therefore an edit box to enter the SQL statement is available.
1. Modify the name of the query object to radiant.
2. Enter the SQL Statement in the SQL Statement option.
Select * from radiant;
3. Check the data. If the displayed data is right click on OK. A Chart Properties dialog box is shown. Then Enter the Name, Title for the chart and choose the needed Type of Graph and its Subtype as display in following diagram.
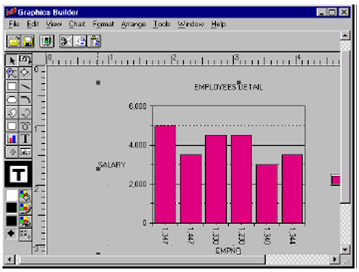
4. Click on Apply and then OK button to accept the values. The accomplished graph will be displayed as display in the subsequent diagram
5. Click on File..Save. A display can be saved in the database or as a file. Therefore, a confirmation to save the file as the 'File System' is asked for. Then Click on OK. After that Save As dialog box is displayed. Choose appropriate drive and directory and enter the file name as radiant.odg as display in the following diagram.
6. Click on File...Run to execute the display. It layout editor would be replaced with the Graphics Debugger window. It displayed for the Categories axis are displayed vertically. Then Click on File...Exit Runtime to return to the layout editor.
To modify to horizontal display, then double click on the Category values in the layout editor. An Axis Properties dialog box is displayed.
Modify the Tick Label Rotation property to horizontal via clicking on the suitable radio button.
PASSING PARAMETERS IN ORACLE GRAPHICS:
The graph created so far is static. It doesn't have the ability to accept values and display a graph accordingly. To build graphs dynamic, it would be essential to describe parameters which accept input values and pass the values to the graph.