Example:
The Rola and Cola Corporation is a professional II nursing home aspiring to become I nursing home. It desires to provide the ultimate in nursing care for patients. The administrator prepares the list of activities, i.e.
i. Perform pilot service for 6 patient in new facility,
ii. put up the facility,
iii. Install all equipment and furnishing,
iv. Recruit staff of nursing home,
v. Train the nurse staff, and
vi. Pass security inspection of Municipal Building Authority.
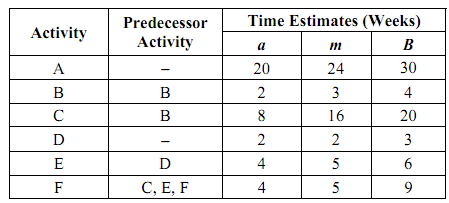
The sequence of these activities is shown in Table
Table: Time Estimate of the Activities

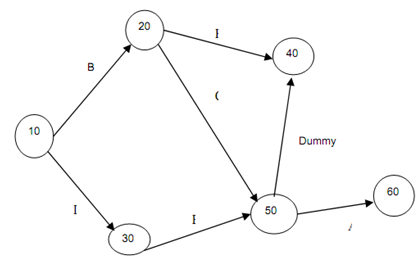
The sequence relationship accomplishing the precedence constraints are illustrated in Figure. Then an arbitrary coding is adopted to make the node identification (Node-10 to Node-60). A dummy activity 40-50 is utilized in the diagram because activity A referred as activity 50-60, should be preceded by activity C, E and F. Now, the next step is to get the time estimate for each activity. Once the time estimate is obtained, then critical path, critical path times and slack times are calculated.

Figure: PERT Diagram

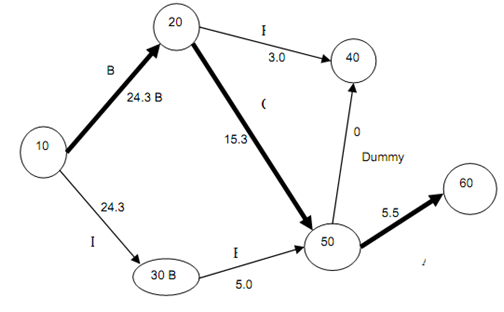
Figure: PERT Diagram
First we calculate the expected time using the Eq. of μ For example, the expected time for activity is
μ = ( a + 4 m + b )/6
te = (20 + 4 (24) + 30)/6 = 24.3
Likewise calculation is performed for all other activities and their results are illustrated in Figure. Now, the critical path is the path with the longest time through the network. But, there are three paths viz. 10 - 20 - 40 - 50 - 60, 10 - 20 - 50 - 60 and 10 - 30 - 50 - 60 with total expected time of 32.8, 45.1 and 12.6 respectively. Thus, the critical path is 10 - 20 - 50 - 60 with the critical path time of 45.1 weeks.