Recapitulation Of Basic Aspects:
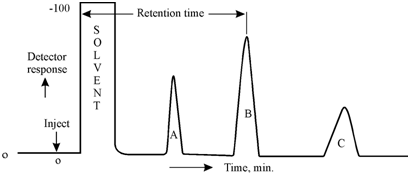
In the operation of a gas chromatograph the, solutes in a mixture are completely vaporised in the injection port and they are moved through the column by a carrier gas under pressure. That is in the column whereas separation takes place. From the column, a separated solutes pass through a detector whereas they are sensed producing an electronic signal. The signal is then amplified and generally displayed on a strip chart recorder. The trace plotted on the recorder is called a "Chromatogram". It is a plot of the detector response within minivolts as a function of time. Commonly, time is the abscissa and minivolts the ordinate.

Figure: A typical chromatogram
From the chromatogram, several general observations can be made.
Under a provided set of experimental conditions, every peak has a features retention time (tR) and the retention volume (VR) which are meaningful in qualitative analysis of solutes. The retention time for solute A is depicted in the figure as the distance from the point of injection to the peak maximum (tR) A. Same, (tR)B and (tR)C are the retention times for solutes B and C, correspondingly. If the flow rate of carrier gas, Fc is constant, then
VR = tR × Fc ... (7.1)
whereas, VR is the retention volume. Therefore, (VR)A, (VR)B, and (VR)C are the retention volumes of solutes A,B and C, correspondingly. In practice, one could use either retention time (tR) or retention volume (VR) for qualitative analysis


(b)
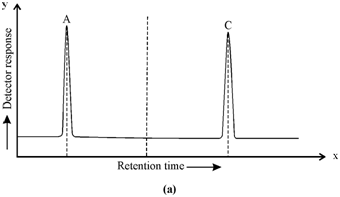
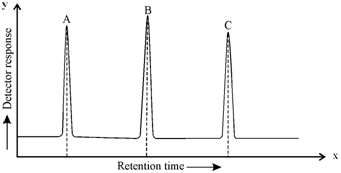
Figure (a): Chromatogram of sample containing 'A' and 'C'; (b) Chromatogram of standard solution containing 'A', 'B' and 'C'