Neural Networks
A neural network is a massively parallel distributed processor made up of simple processing units that has a natural propensity for storing experiential knowledge and making it available for employ. This resembles the brain in two respects as:
- Knowledge is getting by the network from its environment via a learning process.
- Interneuron connection strengths, termed as synaptic weights, are utilized to store the acquired knowledge.
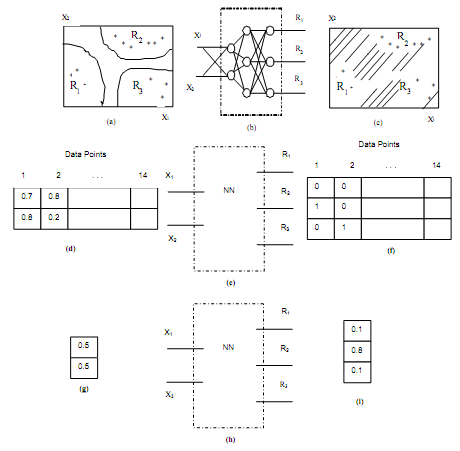
We consider now a method by which a membership function may be created for fuzzy classes of an input data set. We choose a number of input data values and divide them into training data set and a checking data set. The training data set is utilized to train the neural network. Assume an input training data set as shown in following diagram (a). Following table shows the coordinate values of the different data points considered. The data points are expressed along with two coordinates each, because the data shown in following figure (a) represents a two dimensional problem. The data points are firstly divided into different classes by conventional clustering method or technique.
Table no.1 of: Variable Describing the Data Points to be utilized as a Training Data Set
|
Data Point
|
1
|
2
|
3
|
4
|
5
|
6
|
7
|
8
|
9
|
10
|
|
x1
|
0.05
|
0.09
|
0.12
|
0.15
|
0.20
|
0.75
|
0.80
|
0.82
|
0.90
|
0.95
|
|
x2
|
0.02
|
0.11
|
0.20
|
0.22
|
0.25
|
0.75
|
0.83
|
0.80
|
0.89
|
0.89
|

Diagram of: utilizing Neural Network to Determine Membership Functions

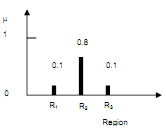
Figure: Membership Function for Data Point (X1, X2 = 0.5, 0.5)
As shown in previous diagram (a) the data point have been divided into three regions, or classes R1, R2, and R3. Assume data point 1, which has input coordinate values of x1 = 0.7 and x2 = 0.8 as previous diagram (d)). As this is in region R2, we allocate to it a complete membership of one in class R2 and zero membership in class R1 and R3 previous diagram (f). Similarly, the other data points are allocated membership values of unity for the classes they belong to initially. A neural network is created previous diagram (b), (e), (h) that uses the data point marked 1 and the corresponding membership values in various classes for training itself to simulate the relationship among coordinate locations and the membership values. Previous diagram (c) represents the output of the neural network that classifies data points into one of the three regions. The neural network then employs the next set of data values and membership values to train itself further as seen in Figure previous diagram (d). This repetitive process is continued till the neural network can simulate the entire set of input-output values. The performance of the neural network is then checked by using the checking data set. One time the neural network is ready, its final version as in previous diagram (h) can be used to find the membership values of any input data (previous diagram (g)) in different regions (previous diagram (i)).
Notice that the points shown in the table in previous diagram (i) are in reality the membership values in each region for the data points shown in previous diagram (g). These could be plotted as a membership function, as shown in above diagram. A complete mapping of the membership of different data points in the various fuzzy classes can be derived to determine the overlap of various classes.