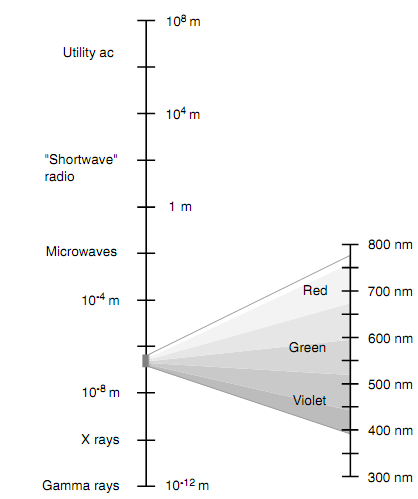
EM Wavelength Scale:
To demonstrate the range of EM wavelengths, we can use a logarithmic scale. The logarithmic scale is required since the range is too great that a linear scale is not practical. The left-hand part of the figure shown below is such a logarithmic scale which shows wavelengths from 108 m down to 10-12 m. Each separation, in the direction of shorter wavelength, symbolizes a 100-fold reduce, or two orders of magnitude. Utility ac is close to the top of this scale; the wavelength of 60-Hz ac in open space is fairly long. The gamma rays are symbolized around at the bottom; their EM wavelengths are minute. It is evident here that visible light takes up only a minute sliver of the EM spectrum. In the right-hand side scale, visible wavelengths are represented in nanometers (nm).

Figure: The EM spectrum from wavelengths of 108 m down to 10-12 m, and an explode view of the visible-light spectrum inside.