Excitation and emission fluorescence spectra:
An emission fluorescence and excitation spectra of 9-methylanthracene is given in Figure.
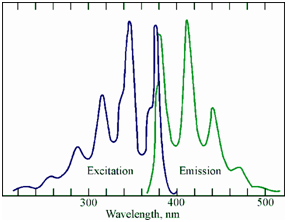
Figure: The excitation and emission fluorescence spectra of 9-methylanthracene
Since a given analyte could fluoresce only after it has absorbed radiation, an excitation spectrum consists of the wavelengths of light in which the analyte is able to absorb. Instead commonly the excitation spectrum of a molecule is the similar as its UV-VIS absorption spectrum. Thus, the excitation spectrum for a compound should not modify if we modify the emission wavelength which is being measured. Therefore, if the excitation spectrum varies along with choice of emission wavelength, we can say in which the observed fluorescence is arising from two or more different substances. This fact might be exploited to check for the purity of the fluorescent analyte. Commonly, the maximum in the fluorescence spectrum of a compound occurs at longer wavelength than the maximum within the absorption spectrum. The wavelength difference among the absorption and fluorescence maxima is known as the Stokes shift.