Fatigue Curve
The fatigue experiments began about 170 years ago, mainly as a result of fatigue failures in rail road equipment. Fatigue loads that are imposed upon machine parts and structures in service may be random in nature as illustrated in Figure 1.36(a) but laboratory tests are performed under sinusoidal stresses for convenience. Techniques have been developed to use these results for application under actual service condition. The sinusoidal stress variation is shown in Figure 36(b) and various terms defined therein. This stress cycle is also termed fluctuating. About 90% of data are collected under fully reversed stress cycle in which the mean stress = 0 and stress ratio
R = σ min / σmax= − 1
where, σmax = maximum stress,
σmin = minimum stress,
σm = mean stress = ( σ max +σmin ) /2 , and
σv = variable stress component = ( σ max - σmin )/2
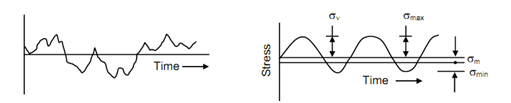
Figure: (a) Random Stress Variation; and (b) Sinusoidal Stress Variation (Fluctuating Stress Cycle)
The stresses that are applied upon the fatigue test specimens can be axial, bending torsion or their combination. In each case a particular type of machine is required. The simplest type of machine, which is largely used, is rotating bending type. In this machine, as shown in Figure , a dead weight is applied upon the specimen through bearing while the specimen rotates. Generally the specimen is loaded as a cantilever or under four points bending. A fatigue testing machine must have a counter to record number of cycles and microswitch to stop motor when specimen fails.
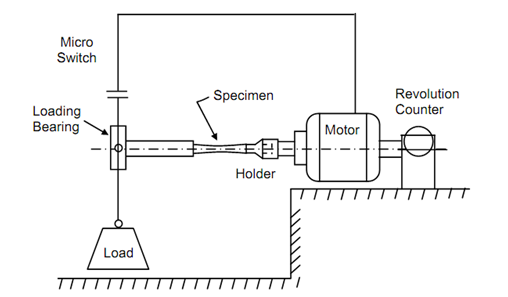
Figure: A Cantilever Type Rotating Bending Fatigue Machine
The fatigue test consists in choosing a stress level and running the specimen at that level until its fails. The number of cycles after which the specimen fails is known as the life of specimen at that stress level and recorded against it. Thus, a number of observations for stress levels and corresponding number of cycles to failure are obtained. Generally several specimens at each stress level are tested.
For obtaining fatigue curves the stress levels are plotted as ordinates and logarithms of number of cycles are plotted as abscissa. For plotting these observations semi-log papers are used. A typical plot of fatigue curve is shown in Figure (a). It can be seen that fatigue curve tends to flatten for large number of cycles. The highest stress level is so chosen that number of cycles of failure is around 104. The fatigue curve is seldom investigated for cycles less than this. Further, the fatigue tests are rarely continued beyond 108 cycles because such long endurances are not common in service and time required for them will be very long.
An important property of great principal importance is deduced from fatigue curve. The fatigue strength of material is defined as the maximum alternating stress which a material will withstand for given number of cycles. This number of cycles is mostly taken at 107 cycles except in some special case. Nevertheless, whenever fatigue strength is described the number of cycles of which it has been determined must also be mentioned.
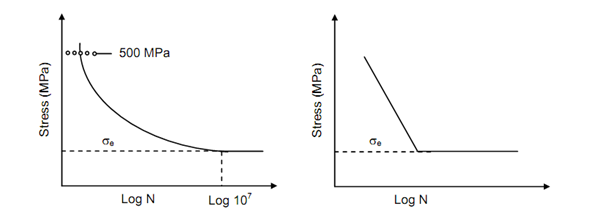
Figure
There are some materials for which failure does not occur once the specimen has endured nearly 106 cycles. The σ - log N curve is then composed of two straight lines, one in the finite region – an inclined line, and other a horizontal line representing non-failures. The stress at which the curve becomes horizontal is known as fatigue limit or endurance limit. illustrates such a curve and is obtained for such materials as mild steel. It may be noted here that mild steel is the material which exhibits yield point in tension test.