Energy level diagram for sodium atom:
You would observe an intense signal at 589 nm in the emission of the sodium atom. That in fact consists of a pair of lines at 589 and 589.6 nm that could not be resolved since of instrumental limitations. This pair of lines originates from the relaxation of the excited electron in 3p to the 3s level and is responsible for the features yellow glow of the sodium light.
The origin of the signals could be rationalised in terms of the energy level diagram, as given in Figure.
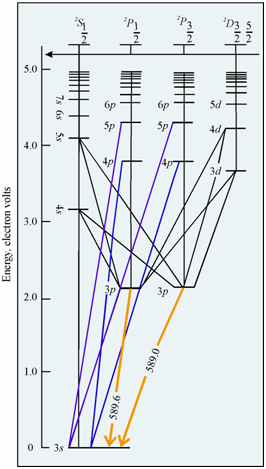
Figure: The energy level diagram for sodium atom
As you have learnt above, within case of atomic emission spectroscopy, an intensity of emission signal depends upon a number of atoms within the excited state. In case of Na the ground state is 2S1/2 (3s) and the excited states are 2P3/2, 2P1/2 (4p), 2P3/2, 2P1/2 (3p), 2D5/2, 2D3/2 (3d), 2S1/2 (4s); and many more. The intensity of the emission although the excited atoms return to the ground state will be maximum from the first excited state, if this transition is permitted (?s = 0, ?l = ±1). As in case of sodium, 2P3/2 and 2P1/2 states would be most populated and transition from this state to ground state is allowed (as it meets the selection rule given above, that is (?s = 0, ?l = ±1)); the intensity of emission from this state would be maximum. The fraction of atoms within the excited states (corresponding to the prominent spectral line) of different elements at several temperatures.