Furnace Atmosphere:
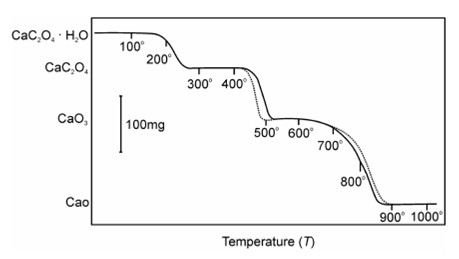
The effect of atmosphere on the TG curve depends on (i) the types of the reaction (ii) the nature of the decomposition products and (iii) type of the atmosphere employed. The effect of the atmosphere on TG curve might be illustrated by taking the example of thermodecomposition of a sample of monohydrates of calcium oxalate in dry O2 and dry N2 as shown Figure.

Figure: TG Curve of Calcium Oxalate in O2 and N2
atmosphere: [ N2 ,----------------- O2]
The first stage, which is dehydration, is reversible reaction.
CaC2O4.H2O(s) ↔ Ca C2O4 (s) + H2O (g ) ... (10.3)
That is unaffected because both gases are equally effective in sweeping the evolved water vapours away from the sample surface. For the second step,
CaC2O4(s) → CaCO3 (s) + CO (g) ... (10.4)
The curve diverges in O2 atmosphere since the oxygen reacts along with evolved CO, giving a second oxidation reaction that is highly exothermic and so raises the temperature of the un-reacted sample. The temperature accelerates the decomposition of the compound more rapidly and fully at a lower temperature as display in the above diagram in dry O2 then in N2 atmosphere. The third step in decomposition reaction is also reversible reaction.
CaCO3 (s) ↔ CaO (s) + CO2 (g) ... (10.5)
This step should not be influenced through O2 or N2. Therefore there is a slight difference in curves for the two gases as display in diagram. The small difference was because of the difference in the nature/composition of CaCO3 created in the two atmospheres. This is due to the surface area, particle size, lattice defects or because of the other physical features of CaCO3 formed.