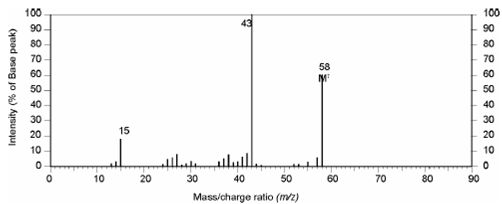
Mass spectrum of compound:
Mass: The mass spectrum shows prominent peaks at m/z 15, 43, 58. The M+ ion appears at m/z 58 while the base peak is at m/z 43. The M+ peak is in accordance with the molecular formula and the base peak (M- 15) is indicative of a stable OCH3 ion which are obtained by the loss of H3 radical from the molecular ion. Similarly the peak at m/z =15 can be attributed to the loss of OCH 3 (M - 43) from the molecular ion.

Figure: Mass spectrum of compound
Therefore, the fragmentation pattern in mass spectrum indicates presence of CH3 and COCH3 groups.
On the basis of the above information i.e. the presence of >C = O group (from IR), - COCH3 and - CH3 (from MS) we may propose the structure of the compound A to be the following.

This structure also explains the equivalence of all the protons observed in 1H-NMR spectrum. Thus, we can say that the compound A is acetone having the structural formula as shown above.