Lineweaver–Burk plot
Because Vmax is accomplished at in?nite substrate concentration, it is not possible to estimate Vmax (and therefore Km) from a hyperbolic plot as described in Figure. Moreover, Vmax and Km can be determined experimentally through measuring V0 at
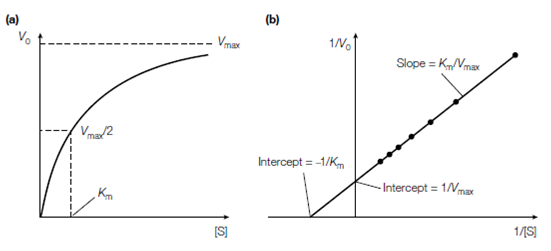
Figure: The relationship between substrate concentration [S] and initial reaction velocity (V0 ). (a) A direct plot, (b) a Lineweaver-Burk double-reciprocal plot
various substrate concentrations see in the figure. Then a double reciprocal or Lineweaver–Burk plot of 1/V0 against 1/[S] is made that plot is a derivation of the Michaelis–Menten equation which is:
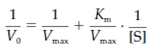
that gives a single straight line with the intercept on the y-axis equal to 1/Vmax and the intercept on the x-axis equal to 1/Km. The slope of the line is equivalent to Km/Vmax. The Lineweaver–Burk plot is also a useful way of determining how an inhibitor binds to an enzyme. The Km and Vmax can also be determined from an Eadie-Hofstee plot of V0/[S] beside V0 whereas the intercept on the x-axis equals Vmax and the slope of the line is equal to1/Km.
Although the Michaelis–Menten model gives a very good model of the experimental data for several enzymes, a few enzymes do not conform to Michaelis–Menten kinetics. These enzymes like as ATCase or aspartate transcarbamoylase are known as allosteric enzymes.