Temperature Effects
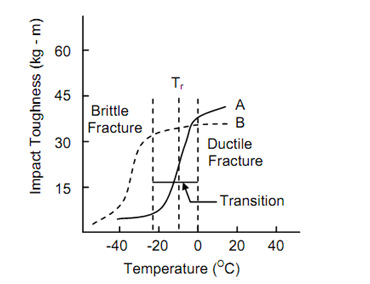
Normally an impact test at room temperature reveals but little about brittle fracture tendencies of steel. It will become useful if the tests are performed at several temperatures below room temperature. Figure 26 depicts how the impact toughness of two steels vary with temperature. While it can be seen that energy absorbed in fracture reduces sharply as the temperature decreases, it also becomes clear that two steels may behave quite differently with temperatures.
Considering steel A, it is observed that over a narrow zone of temperature (between zero and – 20oC) the material changes its behaviour completely from ductile to brittle. (High energy absorption is due to ductile fracture). This temperature range is known as transition range and is centred on a temperature which is termed as transition temperature (Tr). However, temperature Tr is frequently called ductility transition temperature. A lower transition temperature is more desirable in practice as it will guarantee that brittle fracture will not occur within service temperature range.
An important conclusion that can be drawn from Figure is the room temperature impact tests alone are of little consequence. In this figure steel B shows low impact toughness at room temperature but a lower transition temperature, indicating its usefulness in the range of – 20o to 0oC whereas steel A might fail in brittle manner. Thus to understand the material tendency to behave in a brittle manner it is essential to determine the ductile to brittle transition range in terms of temperature.

Figure: Transition in Fracture Mode under Impact Loading
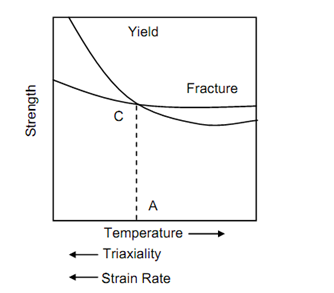
Presence of notch provided one condition for brittle fracture. The qualitative behaviour of material can be understood by accepting the fact that the material has distinct properties as yield strength and fracture strength. Both of these properties decrease with increasing temperature, reducing strain rate and triaxility. However, the reduction rate of fracture
strength is much less than that of yield strength, and hence at certain point these curves 31 intersect as shown in Figure . Thus the yield strength which is initially higher than fracture strength becomes lower after the point of intersection. The specimen loaded on right hand side of the ordinate CA will first reach yield stress and will plastically deform. Contrarily the specimen loaded on left hand side of CA will first reach fracture stress and will thus fail in a brittle manner without showing any plastic deformation. The line CA can be called the line of transition from brittle to ductile. In practice CA becomes a band in which change from brittle to ductile behaviour takes place very fast and its width depends upon the nature of material.

Figure: Various of Yield and Fracture Strengths with Temperature, Triaxiality and Strain Rate
After each impact test, the fracture parts must be explained for details. A brittle fracture, as below temperature Tr exhibits a granular surface which is characteristics of cleavage fracture and absence of any shear deformation. As the temperature rises the part of the notched section, the region near the surface, tends to fracture in shear mode whereby energy absorption in fracture increases. This shear deformation results in transverse contraction of notch section and the percent contraction is sometime reported to indicate the ductility of the material. The fracture surface on which failure occurs due to shear is marked by fibrous appearance and considerably transverse contraction in the notched section. Figure 28 illustrates the fracture surface.
A. Granular surface,
B. Mixed granular and fibrous appearance with some side contraction, and
C. Mixed fracture with considerably fibrous appearance and side contraction, 2d is the total transverse contraction at the notch.

Figure: Impact Fracture Surface Appearance