Monte Carlo Simulation
This is also known as probabilistic simulation method. It may be described like a numerical technique that involves modelling along the objectives of predicting the system's behaviour. The chance element is a very important feature of Monte Carlo simulation and this particular approach may be used while the given process has a chance or random component.
Illustration
Any hotel keeps a record of the number of staff requirement of many categories. Information associating to 200 days' requirements is as following:

Make a simulation model to calculate the demand of staff for a 10-day period.
Solution
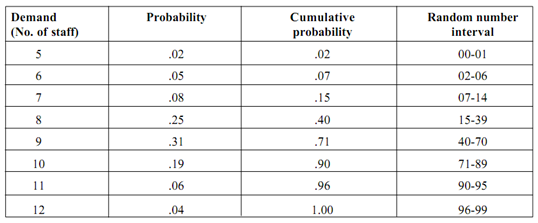
In first, derive the probability distribution of demand for the staff, expressing each frequency in terms of proportions. It is done by dividing each value by 200, for example the total frequency. Therefore ,the resultant distribution would, , be as:

Next, determine random numbers by using any mechanism of random number generator. There are many ways in which random numbers may be generated. These could be result of some device as coin or die, published table of random numbers, etc. The most convenient method, however, is to make utilization of the published table of random numbers, published by the Rand Corporation of USA.
An assignment must be worked out so that the intervals of random numbers correspond to the probability distribution. As the probability have been calculated to two decimal places, which add to 1.00, we require 100 numbers of two digits to represent each of the point of probability. Therefore we take random numbers 00 through 99 to represent them. As now the probability of 5 staff is equivalent to .02, we assign two random numbers 00-01 to this demand level; the probability of 6 staff being equivalent to .05, the next five numbers, 02-06 would be assigned to this level. In a similar manner each of the demand levels would be assigned suitable intervals as shown under:

The Cumulative probabilities column analysis the assigned numbers to correspond to the similar probability range for each of the event.
Next, once the random number intervals are resolute, we decide a tracking pattern for drawing random numbers from the random number table. We may begin with any particular column and row of the table and read the values in any particular set manner horizontally, vertically or diagonally. By utilizing the pattern, we draw the random numbers and match them along with the assigned events.
Assume for the purpose of this problem that we have decided to take every third value horizontally, beginning with the fifth column and fourth row of the table of random numbers. According to this pattern the random numbers, are 61, 74, 24, 03, 59, 16, 84, 92, 52, 07........ etc. (for 10-day demand period). We draw as various random numbers as the number of days' demand needed to be simulated.
The first number, for example 61, lies in the interval 40-70. Corresponding to the demand level of nine people staff. Therefore, for the first day the simulated demand is 9 staff members. In a same manner, we can get the demand for each day. For the 10-day period, we have the following demand:
