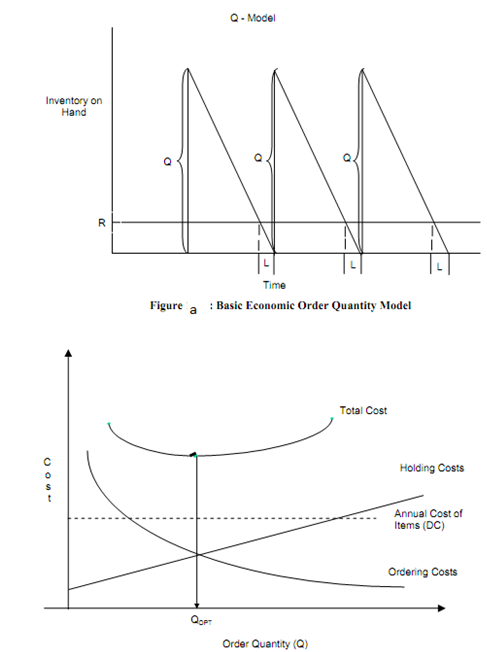
Cost relationships:
These cost relationships are depicted in Figures (a) and (b). The order quantity (Qopt) at which overall cost is minimum may be visualized from Figure (b). It tells that the overall cost is minimal at the point where the slope of the curve is zero. Along With the help of calculus, we take the derivate of whole cost with respect to zero and set this equal to zero. The calculations involved in this are depicted below. To demonstrate the above formula of economic order quantity model, we had taken an instance. These shall demonstrate the use of the formula derived.
TC = DC + (D /Q) S + (Q/ 2) H ------------ (1)
(dTC/ dQ) = 0 + (- DS / Q2) +H/2 ----- (2)
 --------- (3)
Accordingly, reorder point is given by
R = d¯L
where d¯ is average daily demand (constant) and L is the lead time in days.

Figure (b) : Annual Product Costs Based on Size of the Order