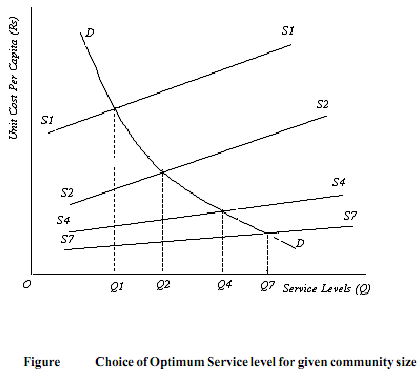
Optimal Service Level:
In Figure various service levels are measured on the x-axis and per capita unit service cost is measured on the y-axis. The individual demand schedule for the service of the entire members of the community is represented by DD as the tastes and income levels of all the members are identical. S1S1 shows the cost of the service to the entire community as a whole. As the slope of the curve shows, the unit cost rises as the service level increases. Of course, this depends on the nature and the related production function of the service S2S2 and S4S4 in the diagram shows different levels of supply schedule to different sizes of communities of N2 and N4 respectively. As the tax structure is given which divides the total cost equally and given the SS schedule, the service level purchased by different sizes of the community will be determined by the intersection of the DD curve with the respective supply schedules. Likewise, the service level purchased with N1 members corresponding to the intersection of S1S1 - OQ1 with DD will be N2 members will be OQ2 and the size required by N member community will be OQ . and so on.
