Optimal Community Size:
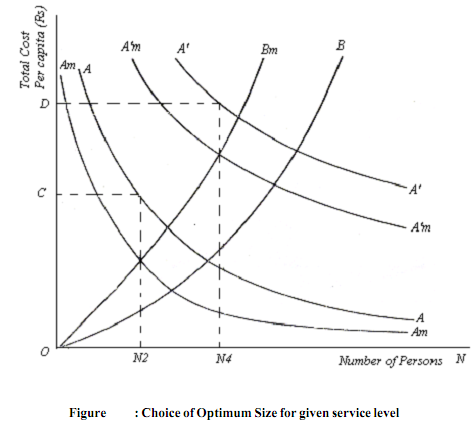
Assuming a given level of public goods and the total cost of the good to the group as a whole is Z rupees, the optimal size for a given service level is shown in Figure. Let us also assume that each member of the local jurisdiction pays a price equal to the marginal benefits received. In other words, the total cost is shared equally among all the members. It may be seen in the Figure that various community sizes are represented on the X-axis while the per capita cost is measured on the Y- axis. It implies that the cost of service declines as the numbers increase. The AA Curve in the diagram shows per capita service cost and the slope of the curve is a rectangular hyperbola with per capita cost equal to Z/N, as the total cost remains equal to Z throughout. The AA curve resembles a decreasing average fixed cost with increasing output as drawn in the usual cost-curve for the individual firm. The curve AmAm which is derived from the AA curve shows a reduction of or a marginal saving of per capita service as the number increases. It can be stated mathematically as AmAm is equal to

In other words, it is the negative of the slope of the AA curve. If such is the situation, the optimal group size would be the entire community and it can be expanded as long as AmAm are positive or the AA curve is downward sloping. But the situation would be changed once the cost of crowding is taken into account.

In the diagram the curve OB shows the per capita cost or disutility of crowding for various sizes of the group while the curve OBm represents the marginal per capita crowding cost. It may be seen from the diagram that the optimal size of the community is given by ON2. At this level, the Bm is equal to Am determining a size with N2 members. According to R. A. Musgrave and P.B. Musgrave, the size of the community will be expanded as long as the per capita savings from cost sharing with a larger group exceeds the additional per capita costs of crowding. Otherwise, the total welfare of the residents would be reduced and therefore not rational. So governmental units of size ON2 would be established with per capita costs for each unit fixed at OC. If the total population is P and total service cost is Z in each community, there will be P/N2 jurisdictions, the per capita costs being Z/N2 .
Again it may be observed from the diagram that if the service level increases, the curves AA and AmAm shift upwards and the optimum size of the group increases further as shown in the diagram. So far a higher level of service wherein the cost is Z1, the per capita cost curve shifts up to A'A' and the marginal cost curve to A1 mA1 m the optimal group size being ON4 at a per capita cost of OD. Thus after knowing about the optimal community size or group size, we now will examine how the optimal service level is determined.