Characteristics of DTA Curves:
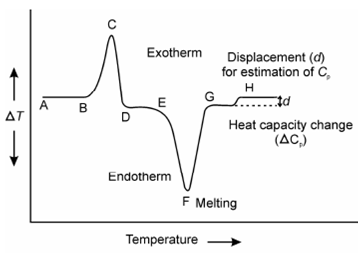
An idealized representation of the two main processes observable in DTA is described in Figure, while ?T is plotted on y-axis and T on x-axis. The Endotherms are plotted downwards and exotherms upwards. As same, the temperature of the sample is greater for an exothermic reaction, than in which of the reference, for endotherms the sample temperature lags behind whcih of the reference.

Figure: A representation of the DAT Curve showing exotherm, endotherm and base line changes
While no reaction occurs in the sample material, a temperature of the sample remains same to in which of reference substance. This is since both are being heated accurately under identical condition that is. temperature difference ?T (Ts-Tr) will be zero for no reaction. But as soon as reaction begins, the sample becomes either hot or cool depending upon whether the reaction is exothermic or endothermic. A peak builds on the curve for the temperature difference ?T against temperature of furnace or time. Let us assume the DTA curve in Figure again, while ?T along the line AB is zero denoting no reaction but at B while the curve starts to deviate from the base line corresponds to the onset temperature at that the exothermic reaction begins and provide rise to a peak BCD along with a maximum at point C. While rate of heat evolution through the reaction is equivalent to the difference among the rate of evolution of heat and inert reference material. The peak temperature C corresponds to the maximum rate of heat of evolution. That does not represent the maximum rate of reaction nor the completion of the exothermic process. Thus, the position of C does not have much significance in DTA experiments.