Interpretation of DSC Curve:
DSC curve of a pure compound is a fingerprint of in which compound in the context of transition temperature as well as heat needed for that transition. Thus, DSC curve could be used to infer about the presence of a particular compounds and its thermal behaviour. The peaks observed shifting of base line either up or down. A classical DSC curve is display in Figure. The peak above the base line is exothermic although down the base line is endothermic.
We have seen above how area under DSC Curves is associated to the amount of energy released or absorbed within a physico-chemical change. It has been displays that under certain conditions the area under the peak is proportional to the amount of heat evolved in a reaction.
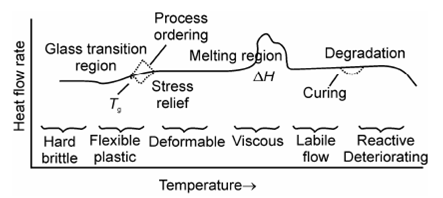
So this field under the curve is used for stochiometric ratio of analyzed compounds (quantitative interpretation). Presently we see in next instance how it could be used to compare thermal stability of a material for physical state and chemical states .This could be used for chemical identification of a material (qualitative interpretation). Such information could be used to select material for certain end-use application, predict product performance and improve product quality. DSC Curves of a polymeric mixture and probable transitions are shown in Fig. for illustration about probable change in behaviour of a polymer sample.

Figure: Change in Behavior of Polymeric Materials in DSC