Graphic Depiction of the Short-Run Cost Curves:
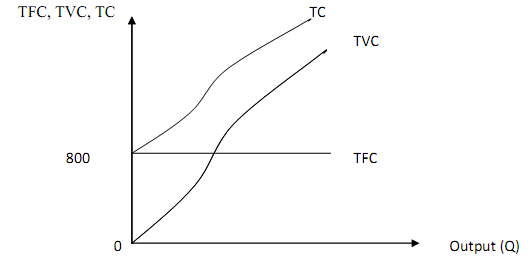
Figure 1 plots total product or output (Q) against total fixed cost (TFC), total variable cost (TVC) and total cost (TC) and total cost (TC). Total output on the horizontal axis and TFC, TVC, and TC on the vertical axis. The total fixed cost (TFC) curve is horizontal in nature and parallel to the output axis. This indicates that TFC is insensitive to changes in the level of output in the short-run. Total variable cost (TVC) starts from the origin (meaning TVC is zero when nothing is produced) and increases as output rises. This is due to the fact that for any increase in output,

there is the need to employ more variable factors in the short-run. Total cost (TC) is equal to TFC (in our case c800) when output level is zero and also increases with output because of the Total Variable Cost effect on it. It must be noted that TC = TFC + TVC hence TVC is a component of TC and as such its behavior with regard to variations in output influences the behavior of TC.
(c) AFC, AVC, ATC and MC Curves

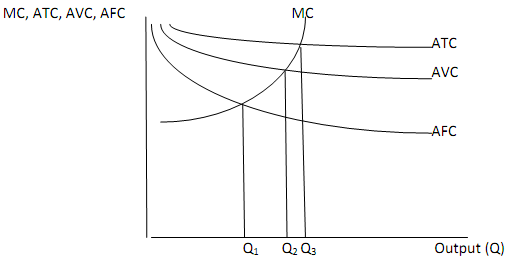
Figure 2: AFC, AVC,ATC and MC Curves
Figure 2 shows the curves of AFC, AVC, ATC and MC. AFC steadily declining throughout. The decline is very sharp at the initial stages as output rises. It however drops slowly at the latter stages. AFC is positive throughout. The AFC curve is always a rectangular hyperbola. The AVC, ATC and MC curves are all “U” shaped as shown in Figure 6.2. This shape is due to the fact that at first, increases in Q results in decreasing AVC, ATC and MC but beyond certain particular points, they increase with increases in output. The AVC and MC are “U” shaped because of the law of diminishing returns to variable proportion.ATC can be obtained by adding AFC to AVC. For those levels of output where both AVC and AFC are falling, ATC must decrease. However, ATC attains its minimum after that of AVC because the decreases in the AFC for a time more than offset the increases in the AVC