Graphical Analysis:
A cost volume profit (or break-even) graph for a retail store of Quality ice-cream company is illustrated below in Figure. Volume of ice cream sold per month is represented on horizontal scale in terms of thousands of liters of ice-cream sold per month. As none of the stores sells more than 10,000 liters per month, it is assumed as the upper volume limit in the relevant volume range. Revenues and costs are plotted on the vertical scale. Steps included in the construction of the graph are as follows:
1. First of all, the revenue line is plotted. It starts from Rs. 0 at zero volumes of sale to Rs. 500,000 per month representing 10,000 liters of sales per month at Rs. 50 per liter.
2. Fixed monthly costs are plotted in the form of a line starting at the level of Rs. 55,000 per month and in horizontal direction.
3. Beginning at Rs. 55000, i.e. the fixed cost line level, variable costs of Rs. 37.25 per liter are plotted. This line also becomes the fixed cost line as this is added on the top of the fixed cost line.
The break even point is 4314 liters per month. Sales below 4314 liters shall result in loss and sales above this point shall lead to operating income.
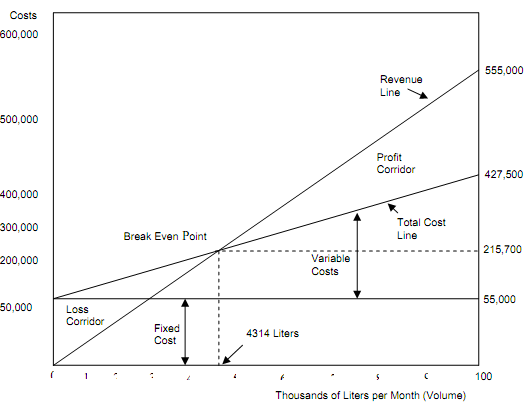
Figure: Cost Volume Profit Graph