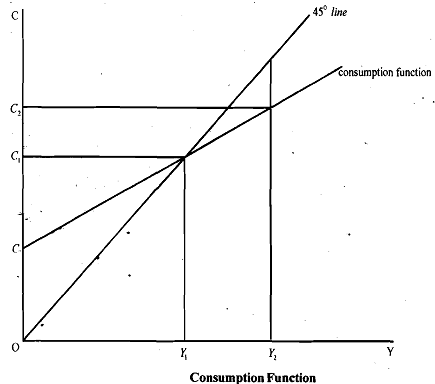
Consumption Function:
Consumption function shows the relationship between c and y. Our consumption function should depict the above features. If we ignore taxes and subsidies by the government, then consumption function in its simplest form is given by

where Ct is current consumption and Yt is current income. The consumption function given in equaction is a straight line with intercept C' and slope c. Here C' is the threshold or minimum consumption when income is zero. Since a household spends only apart oKits income on consumption the value of c should be less than 1. Moreover, c cannot be negative. Thus c remains betwen 0 and 1, that is, 0 < c < 1 . We observe that c is the MPC since c = ΔC / ΔY .Notice an important feature of the consumption function, that is the average propensity to consume (Ct /Yt) falls as income rises.

In Fig. we depict the consumption function. Here we draw a 450 line along which whatever is earned is consumed, that is, C = Y When income level is Y1, consumption equals income as the consumption hction intersects the 450 line. this is level of income is called 'breakeven income', and on the avexage, a family having income Y, consumes whatever Y1 earns. When income is less than Y1 consumption level of the household is more than its income. On the other hand, when income is more than Y2 consumption is less than income. For example, in Fig. when income is Y2 consumption is C2. Notice that when income exceeds Y1 we have C < y .