Calculation of Control Limits and Standard Deviation
The data in the accompanying table illustrated length measurements (in.) taken on a machined workpiece. Sample size is five and the sample number is 10; therefore the total number of parts measured is 50. The quantity x is the average of five measurements in each sample. We first calculate the average of averages x,

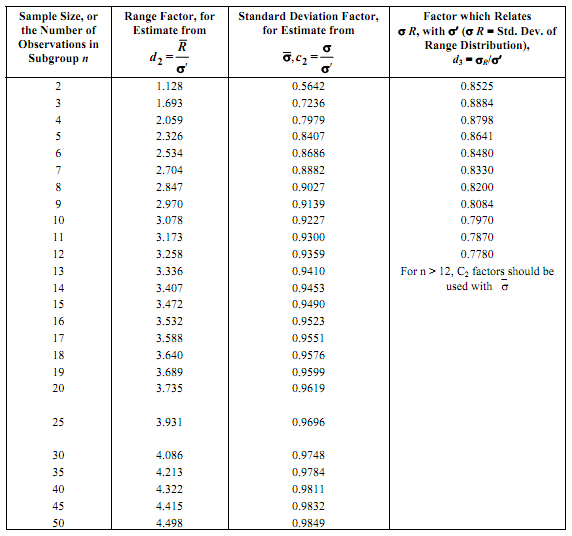
Since the sample size is five, we determine from Table , the following constants :
A2 = 0.58, D4 = 2.11, and D3 = 0. We can now calculate the control limits using Eqs. Thus, for averages we have
UCLx = 4.430 + (0.58) (0.103) = 4.489 in.,
LCLx = 4.430 - (0.58) (0.103) = 4.370 in.,
We can calculate the standard deviation using Eq. σ = R /d2 and a value of d2 = 2.326.
Thus,
σ = 0.103 /2.326
= 0.044 in.
Table : Factors for Estimating the Standard Deviation (σ′) of a Parent Population from Sample Data for the Average Range ( R ) or the Average Sample Standard Deviation ( σ )
