Ideal Gas Law
By combining the outcomes of Charles' and Boyle's experiments, the relationship is as follows:

The constant in the above equation is termed as the ideal gas constant and is designated by R; therefore the ideal gas equation becomes
Pv = RT
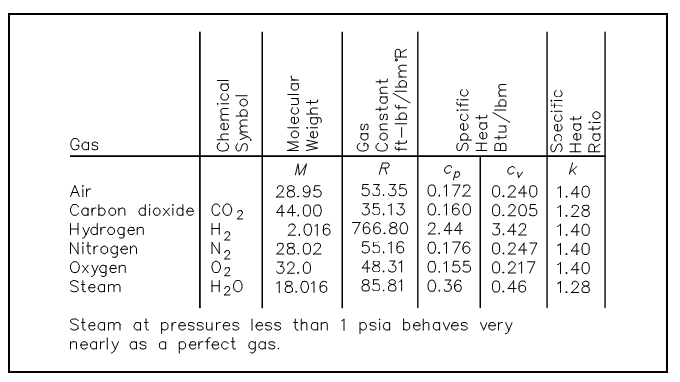
Here the pressure and temperature are absolute values. The values of the ideal gas constant (R) for some of the more general gases are given in figure shown below.

Figure: Ideal Gas Constant Values
The individual gas constant (R) might be acquired by dividing the universal gas constant (Ro) by the molecular weight (MW) of the gas,

The units of R should always be reliable with the units of temperature, pressure, and volume employed in the gas equation. No real gases obey the ideal gas law or equation entirely. At temperatures close to a gases boiling point, rises in pressure will cause condensation to occur and drastic reduces in volume. At very high pressures, the intermolecular forces of a gas are important. Though, most of the gases are in approximate agreement at temperatures and pressures above their boiling point.
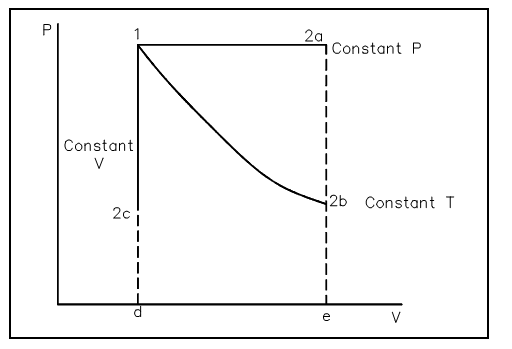
The ideal gas law is used by engineers working with gases since it is easy to use and approximates real gas behavior. Most of the physical conditions of gases employed by man fit the above explanation. Perhaps the most general use of gas behavior studied by engineers is that of the compression by process using ideal gas approximations. Such a compression process might take place at constant temperature (pV = constant), constant volume, or adiabatic (i.e., no heat transfer).Whatever the process, the quantity of work that outcomes from it based upon the process, as brought out in the conversation on the First Law of Thermodynamics. The compression process by using ideal gas considerations outcomes in work performed on the system and is necessarily the region under a P-V curve. As can be viewed in the figure shown below, different quantities of work outcome from different ideal gas processes like constant temperature and constant pressure.

Figure: Pressure-Volume diagram