Estimation Of Sanitary Sewage
The sewer capacity to be provided must be determined from analysis of the present and future quantities expected. The estimation is based upon the contributory population and the per capita flow of the sewage and both the factors depend on the design period. The design period is defined as the length of time upto which the capacity of a sewer will be adequate. While deciding on design period, consideration must be given to the useful life of structures and equipment employed. A design period of 30 years (excluding construction period) is recommended for all types of sewers. The design population will have to be estimated considering all the factors influencing the future growth and development of the area in the industrial, commercial, educational, social, and administrative spheres. Special factors causing sudden immigration should also be accounted to the extent possible. Population forecast is frequently done based on past demographic data and applying an appropriate population forecast method, e.g. Arithmetical Increase, Incremental Increase, Geometrical Increase, or Logistic Method.
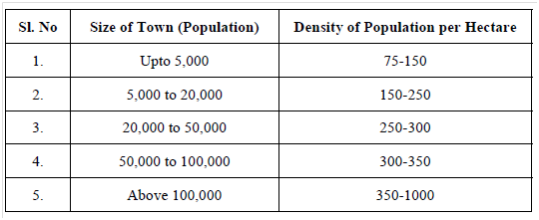
A detailed discussion on the population forecast is, however, beyond the scope of this unit. For new settlements, design flows can be calculated based on the design population and projected water consumption for domestic use and commercial and industrial activity. In case a master plan containing land use pattern and zoning regulation is available, the anticipated population can be based on the ultimate densities (Table 1).
Table 1: Suggested Densities Based on the Size of Town (CPHEEO, 1993)

Knowledge of rates of wastewater flow is required in the hydraulic and process design of a wastewater treatment plant. Hydraulic design seeks to minimize overload problems (backups; flooding), while process design seeks to avoid inefficient operation (e.g. insufficient substrate or insufficient retention). The design must accommodate the variation in domestic wastewater flow rates and the associated waste load (BOD, SS), which occurs over the day. Flow rates are low after midnight when little domestic wastewater is discharged. At that time, a substantial part of the dry weather flow is infiltration and sewage strength is weak. Flow rates increase in the morning as water demand rises and reaches its peak again in the evening at bedtime. There is also a dramatic difference in wastewater flows in dry versus wet periods.
Design flows are best determined from field measurements of wastewater flows. Sanitary sewage is mostly the spent water of the community draining into sewer system with infiltration of some ground water and a fraction of stormwater from the area. Where actual flow rates are not available, rates may be estimated from water use records. About 40-90% of the per capita consumption of water becomes wastewater, since some water is lost due to evaporation, seepage into ground, leakage etc. In arid regions, mean sewage flows may be as little as 40% of water consumption. In well-developed areas the flows may be as high as 90%. Generally, 80% of the water supply may be expected to reach the sewers. However, the sewers should be designed for a minimum wastewater flow of 100 litres per capita per day.
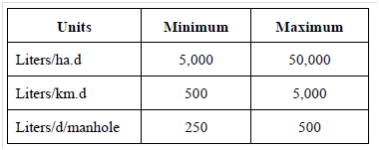
Estimate of flow in sanitary sewers may include certain flows due to infiltration of groundwater through joints. Since sewers are designed for peak discharges, allowances for groundwater infiltration for the worst condition in the area should be made (refer Table 2).
Table 2 : Ground Water Infiltration(CPHEEO, 1993)

With improved standards of workmanship and quality and availability of various construction aids, these values tend to minimum rather than the maximum.
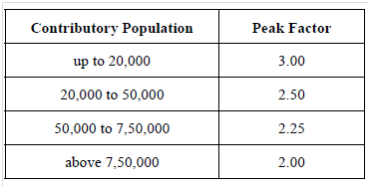
The flow in sewers varies from hour to hour and also seasonally. But for the purpose of hydraulic design estimated peak flows are adopted. The peak factor or the ratio of maximum to average flows depends upon contributory population (Table 3).
Table 3: Peak Factor for Contributory Population (CPHEEO, 1993)

The peak factors also depend upon the density of population, topography of the site, hours of water supply and, therefore, individual cases may be further analysed if required. The minimum flow may vary from 1/3 to 1/2 of average flow.