Constant Pressure Heat Addition
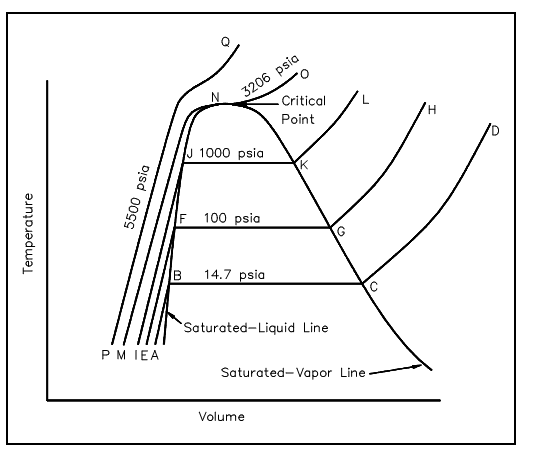
Assume the plot on the temperature-volume diagram of the figure shown below, viewing the constant-pressure line which symbolizes the states via that the water as it is heated from the preliminary state of 14.7 psia and 60°F. Suppose state A symbolize the preliminary state and state B symbolize the beginning of the saturated liquid line (212°F). Thus line AB symbolizes the procedure in which the liquid is heated from the preliminary temperature to the saturation temperature.

Figure: T-V Diagram
The point C is the saturated vapor state, and line BC is a constant-temperature procedure in which the change of phase from liquid to vapor takes place. The line CD symbolizes the procedure in which the steam is super-heated at constant pressure. The temperature and volume both rise during the procedure.
Now assume the process occur at a constant pressure of 100 psia, starting from a preliminary temperature of 60°F. The point E symbolizes the first state, the specific volume become slightly less than 14.7 psia and 60°F. The vaporization now starts at point F, where the temperature is 327.8°F. The point G is a saturated-vapor state, and line GH is the stable pressure procedure in which the steam is superheated.
In a same way, a constant pressure of 1000 psia is symbolized by line IJKL, and the saturation temperature becomes 544.6°F.