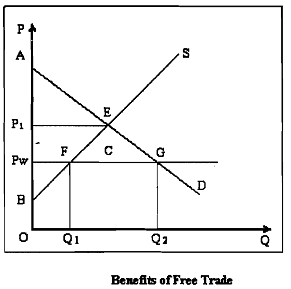
Benefits of Free Trade:
In what follows, we use standard cost-benefit apparatus that analyses welfare gains and losses to various economic agents like households (consumers) and firms (producers) to compare alternatives situations like free trade and autarky.
When Domestic Industry is Perfectly Competitive
We will use a simple diagram (Figure : Benefits of Free Trade) to illustrate the benefits that accrue to a country engaging in free trade.
The main assumptions underlying the diagrammatic analysis are (a) perfect competition in the domestic industry;(b) the industry being considered is a small part of the country's economy (so we can use partial equilibrium analysis); and (c) the country is a small player in the international market for the product, which means that it.can import any amount at the world price Pw(it is a price-taker in the world market).
The downward sloping line AD represents the demand curve for the product of industry X, while the upward sloping line BS represents the domestic supply curve of the industry. In the absence of trade, domestic price of the product of industry X is P1. In this case total social welfare W is the equal to the area of triangle AEB . You should note that W = Consumers' Surplus (Area of triangle AP1E) + Producers' Surplus (Area of triangle BP1E).

Let world price of good X, Pw be below P1. This means the domestic consumers will be better off importing the good. With free trade, good X will be imported and the price of good X in the domestic market will be forced down to Pw. Obviously, domestic firms cannot charge a price higher than Pw, as nobody would buy the. good at a higher price if cheaper imports are freely accessible.
With trade, total domestic demand at price Pw is Q,, which is met in part by domestic supply (of amount OQ1) and partly by imports (amounting to Q1Q2). You should note there is a net gain in social welfare in the post-trade situation, amounting to the area C. Consumer surplus has increased from AP1E to APwG while producers' surplus has fallen from BP1E to BPwF, giving a net gain in welfare of area C. In principle, the losers (the producers) can be compensated by the gainers (the consumers). From the diagram it should be clear to you that the extent of gain in social welfare is positively'related to the gap between P1 and Pw.
Using Figure above we have just carried out a partial equilibrium analysis of fiee trade for an industry. Here we have not considered the secondary effects of trade on the economy. In particular we have not taken into account the effects of trade on factor markets, on the terms of trade, or on the Balance of Payments and exchange rates. However, if the industry being analysed has considerable weight in the national economy these secondary effects can be quite important.