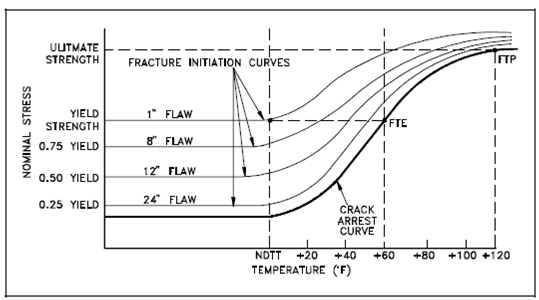
Fracture Diagram:
Below Figure is a graph of stress versus temperature, viewing fracture initiation curves for several flaw sizes.

Figure: Fracture Diagram
It is clear from the above discussion in which we must operate above the NDT temperature to be contained which no brittle fracture could occur. For greater safety, it is desirable in which operation be limited above the FTE temperature, or NDT + 60ºF. Under such conditions, no brittle fracture could occur for purely elastic loads.
As earlier discussed, irradiation of the pressure vessel could increased the NDT temperature over the lifetime of the reactor pressure vessel, restricting the operating temperatures and stress on the vessel. It should be clear in which this increase in NDT could lead to important operating restrictions, particularly after 25 years to 30 years of operation whereas the NDT could raise 200ºF to 300ºF. Therefore, if the FTE was 60ºF at the starting of vessel life and a change in the NDT of 300ºF occurred over a period of time then the reactor coolant will have to be raised to more than 360ºF before full system pressure could be applied.