New Model:
Taking into consideration the deficiencies and inconsistencies in Baumol's model, Haveman and De Bartolo have presented another model. In their formulation, price, cost, output and advertising expenditure are all free to vary. The graphical model, modified by M. Kafoglis, R. Bushnell and C.J.Howkins is presented bellow. But before that, we need to consider the assumptions made on cost and revenue curves.
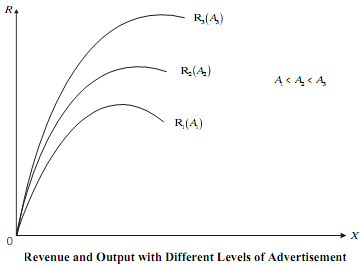
The TR curve shifts up as A increases. Thus by changing A, we can generate a family of TR curves each representing the relationship between total revenue and output at different levels of advertising expenditure. The TR curves are depicted as follows:

Equilibrium of the Firm:
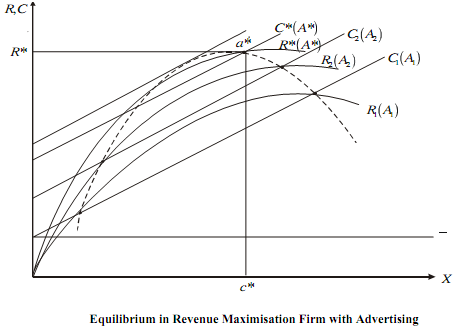
Superimposing Figures and joining the points of intersection of TC and TR curves corresponding to the same level of advertising expenditure, we can derive the 'TC = TR' curve as had been developed by Haveman and DeBartolo. The firm reaches its equilibrium at the highest point of this curve. Hence, from Figure 12.6 we see the equilibrium of the firm at point a* with total costs C*, total revenue R*, output X*, advertising A*, and price equal to OR*/OX*.
