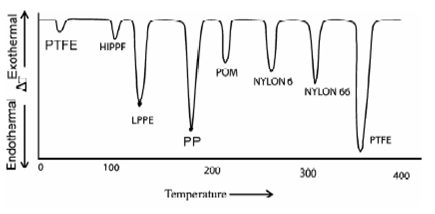
DTA curve of a typical polymeric mixture:
The DTA technique is also used for analyzing a polymeric mixture qualitatively and quantitatively. The individual polymers exhibit their own features peaks. The Figure is differential thermal curve of seven elements polymeric mixture for their melting points: Polypropylene (PP), Polytetrafloroethylene (PTFE), Low Density Polypropylene (LPPE), High Pressure (high dencity) Polypropylene (LPPE), Polypropylene POM, Nylon 6, and Nylon 66.

Figure: DTA curve of a typical polymeric mixture
It is shows features peaks of all the polymers and therefore confirm the presence of individual polymers within the analyzed sample. The area under the peak is associated to the heat of reaction and related to the quantity of material present within the mixture. The DTA graph of ethylene propylene block copolymer denotes two peaks for propylene and ethylene. On comparing areas under the peaks it is found which 51 % ethylene and 49 % propylene present within the analysed block copolymer. A peak height method has been also employed to measure the quantity of polysebacic anhydride within an epoxy resin- sebacic anhydride mixture.