Analysis of Inorganic and Organic Mixtures:
We have already seen which single and pure compound provides features TG curves. Present, we will see how TG Curves could be used in predicting associative quantities of the elements of a mixture.
Binary mixtures
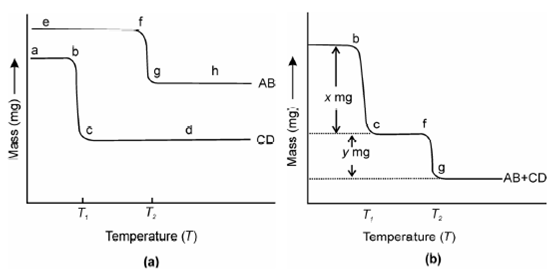
Consider a mixture of two elements AB and CD having characteristic TG Curves that are different from each other as display in Figure

Figure: (a)Thermogravimetric curves of two compounds AB and CD and (b) their Mixture
The decomposition of pure compound AB and CD occur at T1, and labeled as bc and temperature T2, and labeled as fg correspondingly, as described in Figure. The TG curve of mixture of AB and CD together is display in Figure. You could see in this figure, the plateaus (corresponding to the regions of constant mass) commence at about the same temperature as they do in the TG Curves for the pure compounds AB and CD. You could also notice in which the mass loss overall up to T1 is x mg and from T1 to T2 it is an additional y mg. Through measuring these two quantities x and y from the TG curves of Figure we could determine the associative quantities of AB and CD in the original binary mixture. To know further consider the mixtures of calcium and magnesium carbonates.