Cyclic voltammogram:
peak A
RφNO2 + 4e + 4H → RφNHOH + H2O
peak B
RφNHOH → RφNO +2H+ + 2e
peak C
RφNO + 2e + 2H+ → RφNHOH
For assist in "proving" the diagnosis, authentic samples of the hydroxylamine and nitroso derivative could be used to confirm the assignment of peak B and C.
Thyronine is ether that might conveniently be by of as representing the combination of the amino of the amino acid tyrosine along with hydroquinone.
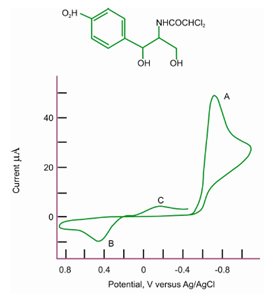
Figure: Cyclic voltammogram of 3.3 mg/25 cm3 chloramphenicol in 0.1 M acetate buffer, pH 4.62. Carbon paste electrode. Scan rate = 350 mV/s
Its oxidative CV on a carbon paste electrode is described in Figure. In this case the scan is initiated within a positive direction from 0.0 volts. The initial two-electron oxidation (peak A) produced a proton and an organic cation that is readily hydrolyzed to benzoquinone and tyrosine.
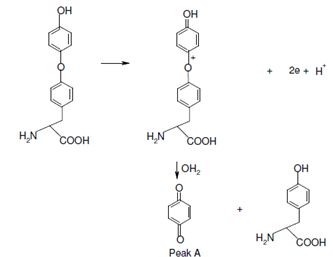
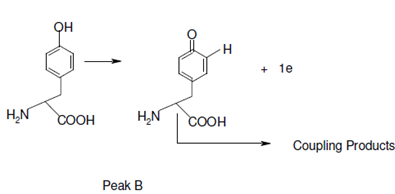
The tyrosine therefore produced is then oxidized at peak B (no product from peak B is detected on the reverse scan).
The benzoquinone is decreased on the reverse scan at peak C to generates hydroquinone,
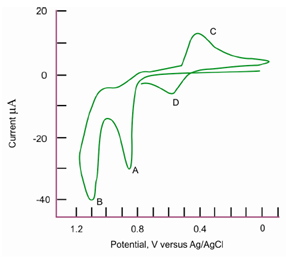
Figure: Cyclic voltammogram of 5 mg/25 cm3 L-thyronine in 1 M H2SO4. Carbon paste electrode, scan rate = 200 mV/s
that is then oxidized back to benzoquinone at peak D on the second positive-going half-cycle.
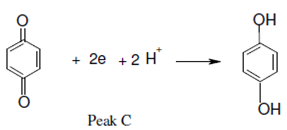
Standard solutions of benzoquinone, hydroquinone, and tyrosine can be used to verify these assignments.
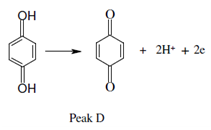
Interpreting complex cyclic voltammograms is frequent a challenge best met through the combination of chemical intuition along with the study of model compounds, exactly in the similar manner used through several spectroscopists to magnetic resonance, interpret optical, or mass spectra.