Quantitative Analysis using ICP-AES:
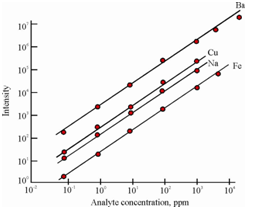
The strength of ICP-AES lies in quantitative analysis. The intensity of an elemental atomic or ion line is used as the anal ytical signal in quantitative atomic emission spectrometry. Actually the spectral intensities are unequivocally related to the elemental concentration in the analyte. Therefore, in practice, AES is a relative method and a calibration has to be performed. At one the analyte matrix is understood and the background and spectral overlap correction details have been worked out the calibration of the instrument becomes rapid and straightforward. The analyst however does not need to bother about making the calibration standards as high purity multielement plasma calibration solutions are commercially available. The calibration curves most often consist of a plot of the output current or voltage of a transducer as a function of analyte concentration. For large concentration ranges log-log plots are employed. Figure shows typical calibration curves for the trace elements analysis by AAS.

Figure: Typical calibration curves obtained for trace elemental analysis by AAS