Data Flow Diagrams
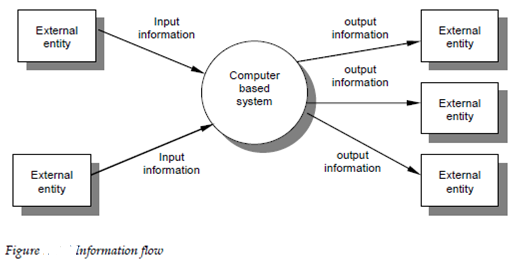
As information moves by software it sis changed through as series of transformations. The data flow diagram is a graphical method which depicts the transforms and information flow which are applied as data move form input to output. The basic form of a data flow diagram is established in the figure 15.10. The DFD is also known as a bubble chart or a data flow graph.


A consumer or producer of information which resides outside the bounds of the system to be modeled

A transformer of information a function which resides within the bounds of the system to be modeled

A data object: the arrow head indicates the direction of data flow

processes; may be as easy as a queue or buffer or as sophisticated as a relational database.

The data flow diagram may be used to illustrate a software or system at any level of abstraction. In reality, DFDs may be partitioned into levels which represent increasing information flow and functional detail. Thus the DFD provides a mechanism for functional modeling as well as information flow modeling. In so doing it satisfies the 2nd operational analysis principle example for creating a functional model.
A level zero DFD which is also called a fundamental system model or a circumstance model represents the entire software parts as a single bubble input and output data indicated through incoming outgoing arrows respectively. Further processes and information flow paths are represented as the level zero DFD is partitioned to reveal more detail. Example for a level one DFD might contain five or 6 bubbles with interconnecting arrows. Each and every of the processes represented at level one are sub functions of the overall system depicted in each circumstance model.
The basic notation used to build a DFD is described in Figure. The rectangle is used to represent an external entity which is a system parts example for hardware, a person another program or another system which produces information for transformation through the software or receives information produced through the software. A circle represents a procedure or transform which is applied to data and changes it in dome way. An arrow represents one or more data objects or data items. All arrows on a data flow diagram should be labeled. The double line represents data store stored information which is use through the software. The easiness of DFD notation is one reason why structured analysis methods are the most broadly used.
It is very important to note that there is no explicit indication of the sequence of processing is supplied through the diagram. The Procedure or sequence may be implicit in the diagram but the explicit procedural representation is commonly delayed until software design.
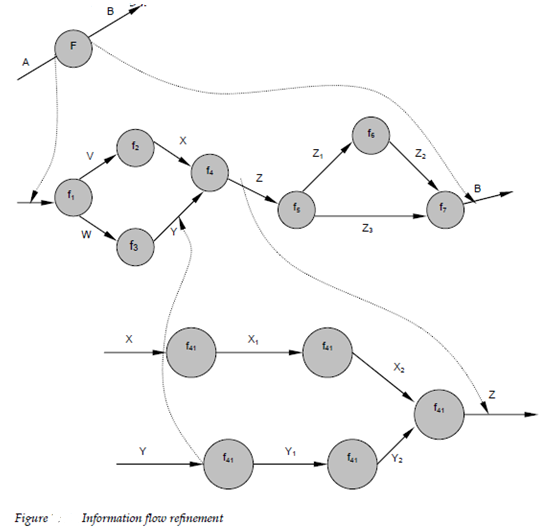
As we noted previously that each of the bubbles may be layered or refined to depict more detail. The Figure describes this concept. The fundamental model for system F indicates the primary input is "A" and ultimate output is B We filter the F model into transforms f1 to f7. Now we have to Note that information flow continuity must be maintained in which input and output to each refinement must remain the similar. The concept sometimes called balancing is essential for the development of consistent models further refinement of f4 depicts detail in the form of transforms f41 to f45. Now again the input X and Y and output Z remains unchanged.
The data flow chart is a graphical tool which can be very valuable in the duration of software requirements analysis. Moreover the diagram can be misinterpreted if its function is confused with the flowchart. The data flow diagram depicts information flow without explicit representation of process logic example for loops or conditions. It is not a flowchart with rounded edges.
The simply notation used to build a DFD is not in itself sufficient to define needs for software. Example for an arrow show in a DFD represents a data object which is input to or output from a procedure. The data store represents some established collection of data. But what is the content of the data implied through the arrow to depict through the store? If the arrow or the store represents a collection of objects what are they? These questions are answered through applying another component of the basic notation for structured analysis the data dictionary.
At the end the graphical notation presented in the Figure 15.11 must be augmented with descriptive text. The processing specification can be used to specify the processing details implied through a bubble within a DFD. The processing specification describes the input to a function the algorithm which is applied to the input and the output which is produced. In further the PSPEC indicates limitations and restrictions imposed on the design and process constraints which may influence the way in that the procedure will be implemented.