Behavioral Modeling
The Behavioral modeling is an operational principle for all needs analysis techniques. Since only extended edition of structured analysis gives a notation for this kind of modeling. The state transition diagram represents the behavior of a system through depicting its states and the events which cause the system to change state. While the STD indicated what actions are taken as a consequence of a particular event?
The state is any observable mode of behavior. Example For states for a control and monitoring system for pressure vessel might be monitoring alarm state, pressure release state and etc. Each and every of these states represent a mode of behavior of the system. The state transition diagram indicated how the system moves from state to state.
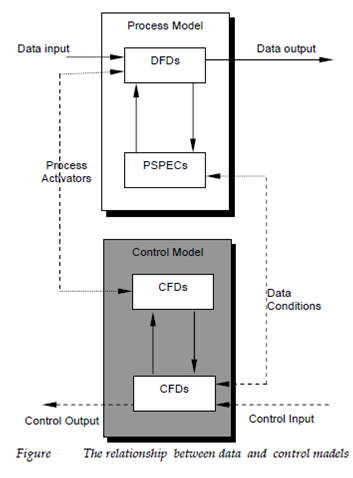
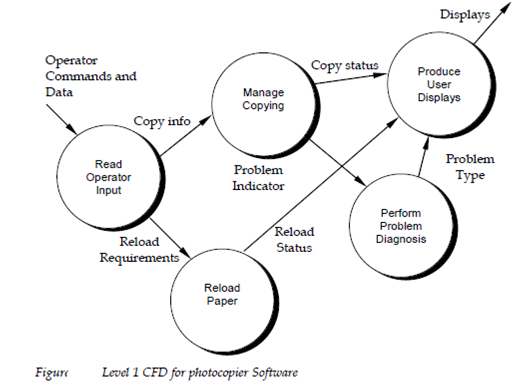
To describe the use of the pirbhai and hatley control and behavioral extension let's take an software embedded within an office photocopying machine. The photocopier describes a number of functions that are implied through the stage one DFD in figure define. It should be noted that additional refinement of the data flow and definition of every data item would be needed.
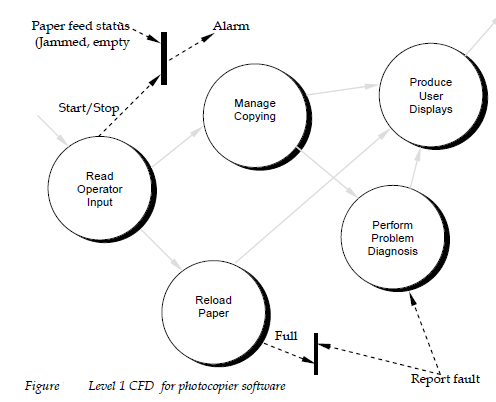
The control flow for the photocopier software is described exiting and entering individual procedure and the CSPEC window. Example for, the paper feed status and start or stop events flow into the CSPEC bar. This implies in which each of these events will cause some procedure represented in the CFD to be activated if we were to examine the CSPEC internals the start or stop event would be shown to activate or deactivate manage copying procedure. As same, the jammed event part of paper feed status would activate perform problem diagnosis. It should be noted which all vertical bars within the CFD refer to the similar CSPEC.
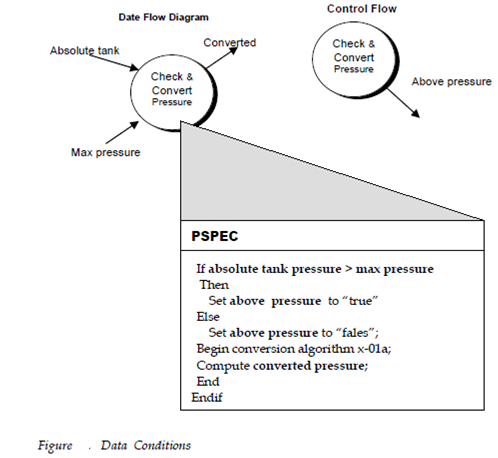
An event flow can be input straight into a procedure as describe with repro fault. Moreover, this flow does not activate the procedure but rather provides control information for the procedure algorithm. Data flow arrows have been lightly shaded for described purposes but in reality they are not define as part of a control flow diagram.
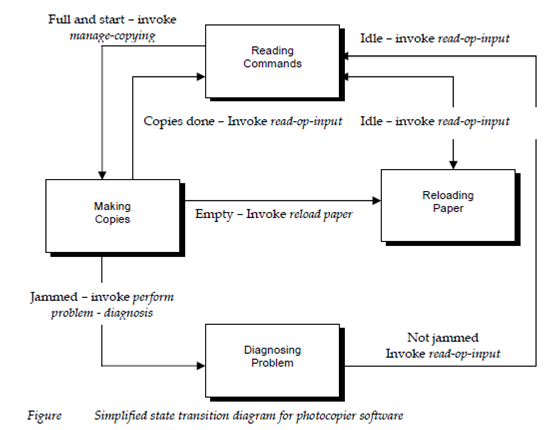
The simplified state transition diagram for the photocopier software defines above is illustrated in figure. Rectangles represent system states and the arrows represent transitions among states and the arrows represent transitions among states. Every arrow is labeled with a ruled expression. The top first value indicates the events which cause the transition to happen. The bottom value indicates the action which happen as a co transition to occur. Thus, when the paper tray is full and the start button is pressed the system moves from the reading commands state to the making copies state. At last Note that states do not necessarily correspond to processes on a 1 to 1 basis.
Example for, the state making copies would encompass both produce the user displays and manage copying processes illustrate in figure.