Yield to call is the yield that would be realized on a callable bond assuming the issuer of the bond redeems it before maturity. A bond's call provision is detailed in the bond indenture. Call dates and call prices are specified in the call schedule. Generally, investors calculate yield to first call and yield to first par call.
Calculation of yield to call is similar to the procedure for calculating yield to maturity except for the bond's call date is taken as the maturity date for the former. Yield to call is calculated by determining the interest rate that would make the present value of the expected cash flows, equal to the market price plus the accrued interest. In case of yield to first par call, the expected cash flows would be the interest payments received up to the first date on which the issuer can call the bond at par. The assumptions made here are:
-
The investor will hold the bond to the assumed call date, and
-
The issuer will call the bond on that date.
For example, assume a Rs.100 rupee par value, 7% 5-year bond is selling for Rs. 104.69 and the first call date is 4 years from now and the call price is Rs.101.50. The bond gives semiannual interest. If the bond is called after 4 years, then the cash flow will be like this:
Table 1: Showing Cash Flows in Different Years
|
Year
|
Receipt
|
Total Receipt in the Year
|
|
1st year
|
Two coupons of Rs.3.50 each
|
Rs.7
|
|
2nd year
|
Two coupons of Rs.3.50 each
|
Rs.7
|
|
3rd year
|
Two coupons of Rs.3.50 each
|
Rs.7
|
|
4th year
|
Two coupons of Rs.3.50 each + call price Rs.101.50
|
Rs.108.50
|
The present value for interest rates is shown in table 2. It is very clear from the table that 6% annual rate makes the present value of the cash flow equal to the price of Rs.104.69. So, 6% is the yield to first call.
Table 2
|
Annual Interest Rate (%)
|
Semiannual Interest Rate (%)
|
Summated PVs of 8 cash flows of Rs.3.50 each (Rs.)
|
PV of Rs.101.50 (Rs.)
|
PV of Total Cash Flow (Rs.)
|
|
5.60
|
2.80
|
24.78
|
81.38
|
106.16
|
|
5.70
|
2.85
|
24.73
|
81.06
|
105.79
|
|
5.90
|
2.95
|
24.62
|
80.44
|
105.06
|
|
6.00
|
3.00
|
24.57
|
80.13
|
104.69
|
Now, we will see the calculation of yield to first par call. Assume that, for the bond given above, the first par call date is 6 years from now. In this case, the cash flow will be like this:
Table 3: Showing Cash Flows in Different Year
|
Year
|
Receipt
|
Total Receipt in the Year
Rs.
|
|
1st year
|
Two coupons of Rs.3.50 each
|
7
|
|
2nd year
|
Two coupons of Rs.3.50 each
|
7
|
|
3rd year
|
Two coupons of Rs.3.50 each
|
7
|
|
4th year
|
Two coupons of Rs.3.50 each
|
7
|
|
5th year
|
Two coupons of Rs.3.50 each
|
7
|
|
6th year
|
Two coupons of Rs.3.50 each + Rs.100.00
|
107
|
The present value for interest rates is shown in table 4. It is very clear from the table that 6.058% annual rate makes the present value of the cash flow equal to Rs.104.69 (only 1 paisa difference). So 6.058% is the yield to first par call.
Table 4
|
Annual Interest Rate (%)
|
Semiannual Interest Rate (%)
|
PV of 12 Payments of Rs.3.50
|
PV of Rs.100.00, 12 Period from Now
|
PV of Cash Flow
|
|
6.005
|
3.00
|
34.83
|
70.12
|
104.95
|
|
6.018
|
3.01
|
34.82
|
70.06
|
104.88
|
|
6.038
|
3.02
|
34.80
|
69.98
|
104.78
|
|
6.058
|
3.03
|
34.78
|
69.90
|
104.68
|
Yield to call can be calculated by using the general formula, as given below, if the coupon payment is made semiannually.
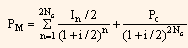
Where,
PM = Present market value.
NC = Number of years to call date (time).
PC = Call price.
In = Interest during the nth period.
i = Discount rate or call rate.