What is Punnett Squares in genetics?
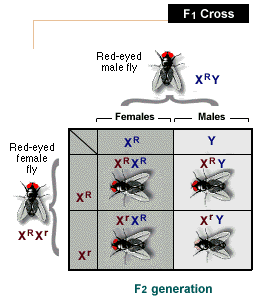
The probability, or likelihood, that a certain phenotypic or genotypic trait will appear in offspring can be predicted and diagrammed using a Punnett square, named after its inventor. Punnett squares can be used to predict probabilities for monohybrid, single trait crosses, or dihybrid crosses, involving two separate traits.

In the Punnett square, the dominant gene may be signified by a letter or abbreviation beginning with a capital letter, such as R for the color red, and the recessive gene designated r, regardless of its color. Homozygous dominant would be RR, heterozygous dominant Rr or rR, recessive rr. In this example to the left, the genotype of the female gamete is listed alongside the columns; the genotype of the male gamete is placed above the rows. Punnett squares allow us to predict the ratio of phenotypes in the offspring.
Punnett squares therefore are used to predict the probability of outcome of specific crosses. This probability is expressed either as a fraction, a decimal, or a percentage. If red petals repeatedly appear in three out of four of F1 offspring of a given cross of flowering plants, we say that the probability of red petals is 3/4, 0.75, or 75%.