What is Plotting Points ?
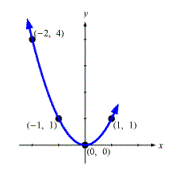
How would you go about drawing the graph of y = x2 ?
One way to do it is by plotting points. (Your graphing calculator uses this method.) This is a kind of "connect-the-dots" technique. First, we find a bunch of points that lie on the graph. Then we connect the dots!
How do we find some points that lie on the graph? Let's pick an x-value at random, say 2. If x = 2, then y = x2 = 22 = 4. So the point (2,4) is on the graph. By picking some more random x- values, we can get some more points:

(1,1), (0,0), (-1, 1), (-2, 4)
Then we connect the dots.
Notice that I drew smooth curves, rather than straight lines, between dots. How do we know that it's a curve and not a bunch of straight lines? We don't*, we just hope it is! We have no guarantee that our graph is accurate in-between the dots.
*(Actually, an advanced calculus student would know for sure that it really is a curve. If you're not yet an advanced calculus student, hang in there!)