1. Suppose that the supply curve for school-teachers is LS = 20,000 + 350W, and the demand curve for schoolteachers is LD = 100,000 - 150W, where L = the number of teachers and W = the daily wage.
a. Plot the supply and demand curves.
b. What are the equilibrium wage and employment levels in this market?
c. Now suppose that at any given wage, 20,000 more workers are willing to work as schoolteachers. Plot the new supply curve, and find the new wage and employment level. Why doesn't employment grow by 20,000?
2. Suppose the adult population of a city is 9,823,000 and there are 3,340,000 people who are not in the labor force and 6,094,000 who are employed.
a. Calculate the number of adults who are in the labor force and the number of adults who are unemployed.
b. Calculate the labor force participation rate and the unemployment rate.
3. The following table gives the demand and supply for cashiers in retail stores.
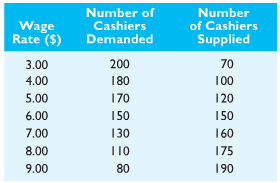
a. Plot the supply and demand curves.
b. What are the equilibrium wage and employment levels in this market?
c. Suppose the number of cashiers demanded increases by 30 at every wage rate. Plot the new demand curve. What are the equilibrium wage and employment level now?
4. From the original demand function in Problem 6 (see table), how many cashiers would have jobs if the wage paid were $8.00 per hour? Discuss the implications of an $8 wage in the market for cashiers.