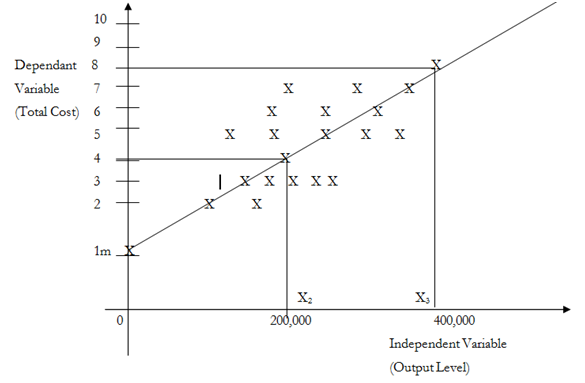
Visual Fit Method of Cost Estimation
Cost estimation is based on past data regarding the dependent variable and the cost driver. The previous data on cost levels and the output levels is plotted on a graph named as a scatter graph and a line of best fit is drawn as displayed in the diagram. A line of best fit is a line drawn so like to cover the most points possible on a scatter graph. Its intersection along with the vertical axis shows the fixed cost while the gradient shows the variable cost per unit.
Example:
Assume a firm has net costs of 8 meter, 4 meter and 1 meter respectively while the output units are as 400,000, 200,000 and respectively. So estimate its cost equation by utilizing the visual fit method.

Note : fixed cost = X0 = 1meter
Gradient = Change in Y/ Change in X
= (Y3-Y2)/(X3-X2)
= Variable cost per unit
Variable cost per unit = Change in cost / Change in activity level
= (8 meter - 4 meter)/ (400,000 - 200,000)
= 20
Net cost equation y = 1 meter + 20 x
On the sources of the existing data, fixed cost is Shs 1 meter and the variable cost per unit is 20. On the sources of the developed model, estimates can be completed regarding future cost. When the activity level is 600,000 units, net cost will be estimated like:
TC = 1 Meter + 20 (600,000) = 1 Meter + 12 Meter = 13 Meter