A new gantry crane for a metal fabrication shop is to be designed. The designer has proposed the following two different configurations:
A. Using only truss elements
B. Using the beam. The beam cross section
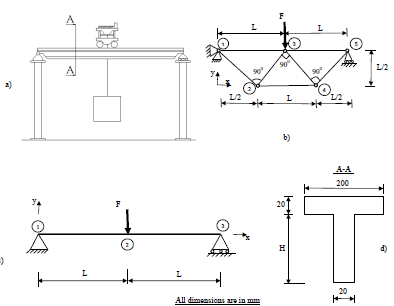
Figure : a) A gantry crane; b) An idealised truss of the crane; c) An idealised beam of the crane into two beam-elements, 1-2 and 2-3; c) Cross-section of the beam elements.
Presenting your FE project report
1. Introduction
Give a short description to the physical problem you are trying to solve. Describe the real structure (not your model), its purpose, and the reason why you want to carry out an analysis on it.
2. Modeling approach and assumptions
Describe how you will tackle modelling your problem. What are your assumptions and simplifications? Will you be using symmetry to solve the problem? Which loads do you have to include, which can you neglect and why? Will you be modelling the entire structure or just parts of it? What will be your focus point in the subsequent analysis process? What type of analysis do you plan to do (structural, thermal, linear, nonlinear, static, dynamic, buckling etc.)
3. Description of the FE model
Describe the FE model(s) which you have built throughout your project to analyse your problem.
This should be the first time you mention terms such as: "elements", "nodes", "degrees of freedom", etc. Describe what element type you are using, what material properties, and what real constants? How many degrees of freedom does your model have? How many elements? What are the boundary conditions? This is obviously the right spot to place an element plot of your model.
4. Analysis results
Show the results of your analysis. The exact nature of this section depends very much on your specific problem. Contour plots of stress, strain, or displacements are great for 2D and 3D problems. Plots of the deformed structure will show how the structure is deflecting. Plots of stress distribution along a path can be used to visualize stress concentrations. Graphs of individual results vs. element size can be used to show the convergence of the h-method. List numerical results only if they are very limited (3 or 4 numbers max.) Most importantly: USE
COMMON SENSE!!! Anything that brings your point across.
5. Model verification
This section should contain some much-simplified calculations, which will allow you to verify your FE model. For example, if you are analysing the stresses and deformation of an airplane wing, you could take a simple cantilever beam model with a point load to see if your FE results yield deflection and stress in the same range. They do not necessarily have to match exactly. If they always would and the structure could be modelled by such a simple model, what's the use of doing FE analysis?
6. Conclusions
Here you should summarize what you have learned from your FE model. Did the results turn out as you expected them? If not, why? What recommendations will you be making based on your analysis. Should the structure be altered so it will not fail? Should the material be changed in order to save weight or to be produced more cheaply? Can FE analysis be used to determine stress concentration factors accurately? Don't just blabla... Imagine someone has paid you big
money to get some answers for the problem he/she asked you to analyse and so he/she expects you to summarize your findings such that they are straight forward and clearly point out what needs to be done.