True color matrice - image processing, MATLAB in Engineering

Assignment Help:

True color matrice:

The true color matrices are the other way to represent images. The true color matrices are 3-dimensional matrices. The first two coordinates are the coordinates of pixel. The third index is the color component; (:,:,1) is the red, (:,:,2) is the green, & (:,:,3) is the blue component. Each and every element in the matrix is of the type uint8 that is an unsigned integer type by using 8 bits. With 8 bits, 28 (or 256) values can be stored and therefore the range of values is 0 to 255. The minimum value, 0, shows the darkest hue available so all 0's answers in a black pixel. The maximum value, 255, shows the brightest hue. For illustration, when the values for a given pixel coordinates px and py (px,py,1) is 255, (px,py,2) is 0 and (px,py,3) is 0 then that pixel will be bright red. All 255's outcomes in a white pixel.

The image function shows the information in the 3-dimensional matrix as an image.

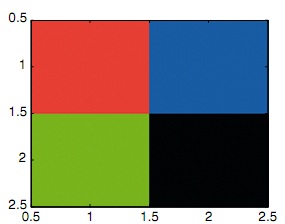
For illustration, this generates a 2× 2 image as shown in figure below. The matrix is 2×2×3, where the third dimension is the color. The pixel in position (1,1) is red, the pixel in position (1,2) is blue, the pixel in position (2,1) is green, and the pixel in position (2,2) is black.


>> mat(1,1,1) = 255;

>> mat(1,1,2) = 0;

>> mat(1,1,3) = 0;

>> mat(1,2,1) = 0;

>> mat(1,2,2) = 0;

>> mat(1,2,3) = 255;

>> mat(2,1,1) = 0;

>> mat(2,1,2) = 255;

>> mat(2,1,3) = 0;

>> mat(2,2,1) = 0;

>> mat(2,2,2) = 0;

>> mat(2,2,3) = 0;

>> mat = uint8(mat);

>> image(mat)

673_true color matrixc.png


Related Discussions:- True color matrice - image processing

Illustration of graphics properties, Illustration of Graphics properties: ...

Illustration of Graphics properties: A particular property can also be exhibited, for illustration, to view the line width:     >> get(hl,'LineWidth')     ans =

Algorithm for the function e, Algorithm for the function e: The algori...

Algorithm for the function e: The algorithm for the function eoption is as shown: Use the menu function to show the 4 choices. Error-check (an error would take place

Indexing into vectors of structures, Indexing into Vectors of structures: ...

Indexing into Vectors of structures: Frequently, when the data structure is a vector of structures, it is essential to iterate through the vector in order by various fields. F

Illustration of initializing the data structure, Illustration of initializi...

Illustration of initializing the data structure: illustration of initializing the data structure by preallocating is here as shown: >> cyls(3) = struct('code', 'c', 'dimen

Derivatives and plot, Use polyval to evaluate the derivative at xder. This...

Use polyval to evaluate the derivative at xder. This will be the % slope of the tangent line, "a" (general form of a line: y = ax + b). % 4. Calculate the intercept, b, of t

Cross product of matrix, Cross Product: The cross or outer product a ×...

Cross Product: The cross or outer product a × b of two vectors a and b is defined only whenever both a and b are the vectors in three-dimensional space, that means that they b

Function cellplot - cell array, Function cellplot - Cell array: The fu...

Function cellplot - Cell array: The function cellplot place a graphical display of the cell array in a figure Window; though, it is a high-level view and fundamentally just di

Illustration of if - else statement, Illustration of if - else statement: ...

Illustration of if - else statement: The one application of an if-else statement is to check for errors in the inputs to a script. For illustration, a former script prompted t

Matlab assignment, 1. Write a MATLAB function (upperTriangle) using the fun...

1. Write a MATLAB function (upperTriangle) using the functions you previously created to convert a matrix to upper triangular form. Start with row 1, column1. Find the row that has

Frd to ss, I have a frequency response data. How do I convert that to state...

I have a frequency response data. How do I convert that to state space? I am given a 6 row and 3 column data (steady state). How do i convert that to state space model?

Write Your Message!

Captcha
Free Assignment Quote

Assured A++ Grade

Get guaranteed satisfaction & time on delivery in every assignment order you paid with us! We ensure premium quality solution document along with free turntin report!

All rights reserved! Copyrights ©2019-2020 ExpertsMind IT Educational Pvt Ltd