To create a relative frequency histogram, Advanced Statistics

Assignment Help:

The total amount of protein produced by a dairy cow can be estimated from periodic testing of her milk.  The following are the total annual protein production values (lb) for 28 two-year old Holstein cows.  Diet, milking procedures, and other conditions were the same for all the animals.

1670_22.png


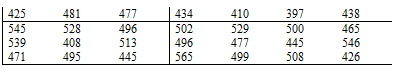
The following parts will create a histogram using 5 classes that describes the data above.  Use the column headers when answering the parts:


13_22.png

(a)     To determine the width of each class:
What is the difference between the highest and smallest data value (range)?
The width of each class is given by the formula:
                       WIDTH = INTEGER(range/5) +1
What is the width?

(b)     Each class has a lower class (left endpoint) and an upper class (right endpoint).  For the FIRST class, the left endpoint is given by the smallest value, and the right endpoint is given by the formula: LEFT ENDPOINT + WIDTH - 1.  What is the interval for the first class?  What are the remaining classes?

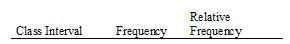
(c)    To determine frequency, count the number of data values that fall into each of the five classes from part (b).  You should have a total count of 28 in the end.

(d)    To determine relative frequency, divide each count by the total (28).  As a check, the sum of the relative frequencies is 1 (or 100%).

(e)     To create a relative frequency histogram, the class interval goes along the horizontal axis, and the relative frequency (expressed in percentage) goes along the vertical axis.  Create a relative frequency histogram.  Based on the sketch, describe the distribution (symmetric, skewed left, skewed right).


Related Discussions:- To create a relative frequency histogram

Falsediscoveryrate (fdr), The approach of controlling the error rate in an ...

The approach of controlling the error rate in an exploratory analysis where number of hypotheses are tested, but where the strict control which is provided by multiple comparison p

Hypothesis testing paper, Prepare a 1,400- to 1,750-word paper in which you...

Prepare a 1,400- to 1,750-word paper in which you formulate a hypothesis based on your selected research issue, problem, or opportunity. Address the following: •Describe your sele

Explain markers of disease progression, Markers of disease progression : Qu...

Markers of disease progression : Quantities which form a general monotonic series throughout the course of the disease and assist with its modelling. In uasual such quantities are

NULL HYPOTHESES, Ask questT-TEST? ion #Minimum 100 words accepted#

Ask questT-TEST? ion #Minimum 100 words accepted#

Line-intersect sampling, Line-intersect sampling is a technique of unequal...

Line-intersect sampling is a technique of unequal probability sampling for selecting the sampling units in the geographical area. A sample of lines is drawn in a study area and, w

Blinder oaxaca method, Blinder Oaxaca method: A method or technique used f...

Blinder Oaxaca method: A method or technique used for assessing the effect of the role of income on racial wealth gap. The method or technique is based on the decomposition of the

Multitrait multi method model (mtmm), Multitrait multi method model (MTMM) ...

Multitrait multi method model (MTMM) is the form of confirmatory factor analysis model in which the different techniques of measurement are used to measure each of the latent vari

Dropout, A subject who withdraws from the study for whatever reason, advers...

A subject who withdraws from the study for whatever reason, adverse side effects, noncompliance, moving away from the district, etc. In number of cases the reason may not be known.

Write Your Message!

Captcha
Free Assignment Quote

Assured A++ Grade

Get guaranteed satisfaction & time on delivery in every assignment order you paid with us! We ensure premium quality solution document along with free turntin report!

All rights reserved! Copyrights ©2019-2020 ExpertsMind IT Educational Pvt Ltd