The linear regression, Basic Statistics

Assignment Help:

Print out your results and bring them with you to the midterm as there will be additional questions on the midterm related to this analysis.  You must hand in your take-home by the beginning of the test.  Late take-homes will not be accepted.   You make work in groups of up to 4 people.  If there is evidence of collaboration beyond that, either in that your group is larger than 4, or that you gave answers to other teams, you will get a 0 on the entire test and be reported to the judiciary committee for cheating.  You will not be graded any differently whether you work individually or in a group, no matter what the group size is (as long as  no more than 4.  Only one take-home per team should be turned in   (If you  have team members from both sections, turn in take-home at 8:10. )

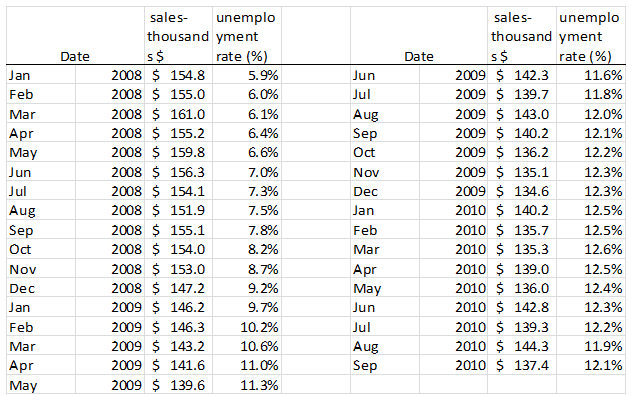
Paxcelli owns a local store that sells leather furniture, and she needs to be able to predict what sales are likely to be.  She has 33 months of past sales data.  She's also gone to the Bureau of Labor Statistics website to look up the state unemployment rate.  (Hint: Download this from the website to avoid entering data by hand!)

2058_table sales.png

Use MS Excel.  You may use either regression technique that was demoed in class, but you will be expected to be familiar with how to interpret the solutions for BOTH at the time of the midterm.

Part A   Perform the appropriate linear trend analysis in Excel

Part B    Perform the appropriate associative forecast in Excel

For both part A and B

* Circle the correct values for  a (intercept), b (slope), and R2.

* Provide an  Excel graphic that displays both the underlying data and the linear regression.  If the graphics are too small, badly distorted or hard to see, you don't get credit.

The formatting points (2 full points!) goes to you if you have done all of the following correctly:

 * List all team members in alphabetic order, A to Z, by last name, at the top right of the 1st  page.

 * Provide at most 2 pages- ONE for part A, ONE for part B  (cover sheets are wasteful!)

 * If handling in more than 1 page, fasten them with a stapler.  


Related Discussions:- The linear regression

DATA fREQUENCY, Table 2: Mathematics Score/Jadual 2: Skor Matematik 27 37 3...

Table 2: Mathematics Score/Jadual 2: Skor Matematik 27 37 30 28 39 25 45 28 32 28 26 38 31 30 47 41 a) Based on Table 2, organize the data into a frequency distribution by taking

Word problem, Suppose that cars pass a certain toll booth at an average rat...

Suppose that cars pass a certain toll booth at an average rate of 10 cars per minute between the hours of 7 a.m. and 9 a.m. The random variable X counts the number of cars that pas

Index number, Why index numbers serve as economic barometers?

Why index numbers serve as economic barometers?

Working capital, prepare an estimate of working capital requirements from t...

prepare an estimate of working capital requirements from the following information 1. project annual sales 1,00000/- 2. selling price Rs. 8/unit 3.percentage of net profit on sale

#tiMEDIANtle.., #quHOW TO MAKE ASSIGMENT ON MEDIANestion..

#quHOW TO MAKE ASSIGMENT ON MEDIANestion..

PROBABILITY DISTRIBUTIONS, a). Show that if a random variable has a uniform...

a). Show that if a random variable has a uniform density with the parameters a and ß, the probability that it will take on a value less than a+p(ß-a) is equal to p b). Prove that t

Determine the relative strength, The results of a study using focused compa...

The results of a study using focused comparison techniques showed that two independent variables distinguished between successful and unsuccessful negotiations with the US on secur

Determine the mean and standard deviation, 1.)  Two dice are rolled and the...

1.)  Two dice are rolled and the sum is calculated.  Let X represent the sum of the two dice. Construct a probability distribution expressing probabilities in fractional form. 2

Compute the z scores, 1. Compute the z scores for the following raw scores ...

1. Compute the z scores for the following raw scores where   = 78 and the standard deviation = 4. a. 72 b. 82 c. 78 d. 87 e. 71

Write Your Message!

Captcha
Free Assignment Quote

Assured A++ Grade

Get guaranteed satisfaction & time on delivery in every assignment order you paid with us! We ensure premium quality solution document along with free turntin report!

All rights reserved! Copyrights ©2019-2020 ExpertsMind IT Educational Pvt Ltd