The f-wald test, Advanced Statistics

Assignment Help:

Primary Model

Below is a regression analysis without 17 outliers that have been removed

Regression Analysis: wfood versus totexp, income, age, nk

The regression equation is

wfood = 0.378 - 0.00129 totexp - 0.000054 income + 0.00170 age + 0.0317 nk

Predictor              Coef       SE Coef           T          P         VIF

Constant         0.37816     0.01356         27.89  0.000

totexp         -0.00128554  0.00006284  -20.46  0.000    1.324

income        -0.00005410  0.00004950   -1.09   0.275    1.341

age              0.0016993    0.0003058      5.56   0.000    1.065

nk                0.031717      0.004676        6.78   0.000    1.007

S = 0.0880161   R-Sq = 28.0%   R-Sq(adj) = 27.8%

Analysis of Variance

Source               DF       SS          MS         F           P

Regression         4      4.5159    1.1290  145.73  0.000

Residual Error   1497  11.5970   0.0077

  Lack of Fit       1328   10.1731  0.0077    0.91  0.806

  Pure Error        169    1.4239    0.0084

Total                  1501  16.1129


Secondary Model

Below is a regression analysis without 17 outliers that have been removed and dropping the income variable   

Regression Analysis: wfood versus totexp, age, nk

The regression equation is

wfood = 0.376 - 0.00132 totexp + 0.00165 age + 0.0317 nk

Predictor         Coef     SE Coef       T      P    VIF

Constant       0.37593     0.01341   28.04  0.000

totexp     -0.00131710  0.00005581  -23.60  0.000  1.045

age          0.0016462   0.0003019    5.45  0.000  1.038

nk            0.031672    0.004676    6.77  0.000  1.007

S = 0.0880218   R-Sq = 28.0%   R-Sq(adj) = 27.8%

Analysis of Variance

Source               DF       SS          MS          F           P

Regression         3       4.5067   1.5022   193.89  0.000

Residual Error   1498  11.6063  0.0077

  Lack of Fit       644    4.9570    0.0077    0.99     0.560

  Pure Error      854     6.6493    0.0078

Total               1501    16.1129

The Null Hypothesis - H0: No difference between the primary and secondary model

1465_The F-Wald Test.png

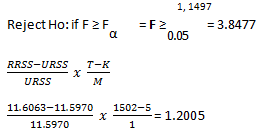
Since the F value is 1.2005 < 3.8477 there is sufficient evidence to suggest that we accept H0 implying that there is no difference between the primary and secondary model and income can be removed.


Related Discussions:- The f-wald test

Explain laplace distribution, Laplace distribution : The probability distri...

Laplace distribution : The probability distribution, f(x), given by the following formula   Can be derived as the distribution of the difference of two independent random var

Half-normal plot, Half-normal plot is a  plot for diagnosing the model inad...

Half-normal plot is a  plot for diagnosing the model inadequacy or revealing the presence of outliers, in which the absolute values of, for instance, the residuals from the multipl

Event studies, can you help specify the model for an event study and to int...

can you help specify the model for an event study and to interpret the results/

Cumulative frequency distribution, The tabulation of a sample of observatio...

The tabulation of a sample of observations in terms of numbers falling below particular values. The empirical equivalent of the growing probability distribution. An example of such

Alternative hypotheses and spss calculation, 1) Question on the first day q...

1) Question on the first day questionnaire asked students to rate their response to the question Are you deeply moved by the arts or music? Assume the population that is sampled

Higher criticism, Higher criticism is a multiple-comparison test concept a...

Higher criticism is a multiple-comparison test concept arising from the situation where there are number of independent tests of significance and interest lies in the rejecting jo

Regression diagnostics, Regression diagnostics is the process designed to...

Regression diagnostics is the process designed to investigate the suppositions underlying particular forms of regression examination, for instance, homogeneity of variance, norma

Quittingill effect, Quittingill effect is a  problem which occurs most fre...

Quittingill effect is a  problem which occurs most frequently in studies of the smoker cessation where smokers frequently quit smoking following the onset of the disease symptoms

Fisher''s exact test, The alternative process to make use of the chi-square...

The alternative process to make use of the chi-squared statistic for assessing the independence of the two variables forming a two-by-two contingency table particularly when expect

Interior analysis, Interior analysis is the  term now and again applied to...

Interior analysis is the  term now and again applied to analysis carried out on the fitted model in regression problem. The basic target of such analyses is the identification of

Write Your Message!

Captcha
Free Assignment Quote

Assured A++ Grade

Get guaranteed satisfaction & time on delivery in every assignment order you paid with us! We ensure premium quality solution document along with free turntin report!

All rights reserved! Copyrights ©2019-2020 ExpertsMind IT Educational Pvt Ltd