The budget line, Macroeconomics

Assignment Help:

The Budget Line: The Consumer Constraints

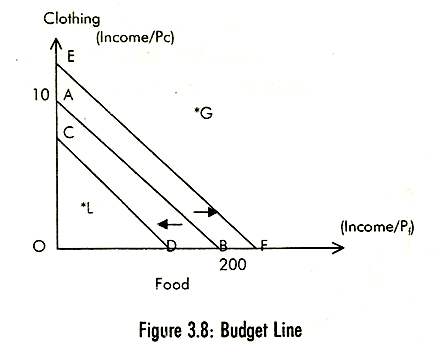
The consumer would like to maximize his satisfaction by reaching the highest possible indifference curve. But in the process, he faces constraints in form of his income and prices of goods and services for which he has to make payment. The budget line shows various combinations of food and clothing that a consumer can purchase given his money income and prices of the two goods. Suppose the consumers' money income (M) is Rs 600 per week and the price of food (Pf) is Rs 3 and the price of clothing (Pc) is Rs 60. Fig. 3.8 shows that if the consumer spends all his income on food, he would buy 200 units of food per week (point B). On the other hand, if he spends all his income on clothing he could buy 10 units of clothing per week (point A).

By joining points A and B by a straight line we define budget line AB. Thus, the budget line depicts 'all combinations of two goods that a consumer can purchase by spending his given money income on the two goods at their given prices. Each such combination is represented by a point on the budget or price line.

The budget equation can be written in the form:

QX, Pf + Qy.Pc = M

where Qx and Qy are the respective quantities of food and clothing purchased.

1953_budget line.png

Slope of AB = Pf /Pe

Any point outside the given price line, like G, is not attainable by the consumer and at point L the consumer underspends his income. An increase in the money income, prices remaining constant or an equal proportionate increase in prices (ceteris paribus), shifts the budget line upwards parallel '(line EF) to the original budget line. Similarly, a decrease in the money income shifts the budget line downwards (line CD).

750_budget line1.png

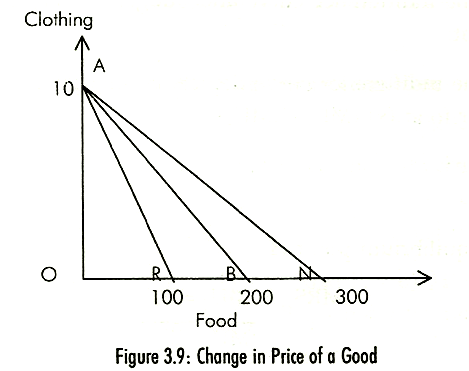
With a change in price, the budget line will rotate on the axis representing the good whose price has changed, money income and price of the other good remaining constant. A decrease in the price of the good pivots the budget line to the right or outwards and vice versa. In Fig. 3.9 a decrease in the price of food to Rs 2 rotates the budget line to the position AN and an increase in price to Rs 6 pivots the budget line inwards to AR.


Related Discussions:- The budget line

Central banking, what are the qualitative methods of controling credit

what are the qualitative methods of controling credit

Traditional or a roth ira, Suppose one of your clients is four years away f...

Suppose one of your clients is four years away from retirement and has only $1,500 in pretax income to devote to either a Roth or a traditional IRA. The traditional IRA permits inv

Money and Banking, explain with illustration the meaning of credit creatio...

explain with illustration the meaning of credit creation in commercial banks

Money multiplier, what is money multiplier? what is role , importance, adva...

what is money multiplier? what is role , importance, advantages , disadvantages , limitations and examples of money multiplier?

Long-run labor demand, Long-Run Labor Demand: Graph an increase in the...

Long-Run Labor Demand: Graph an increase in the wage when only labor is a 'normal' input to production. Graph an increase in the wage when both inputs are 'normal'

Long-run framework, In the long-run framework, deficits reduce: A. investme...

In the long-run framework, deficits reduce: A. investment. B. taxes. C. government consumption. D. subsidies.

Unusually high period, The consumer price index for the 1978-82 periods and...

The consumer price index for the 1978-82 periods and the GDP deflator follow. This was a period of unusually high, but declining, inflation. (The CPI is equal to 100 in the base ye

Give brief explanation about the labour market, Introduction of labour mark...

Introduction of labour market A vital macroeconomic variable is the total amount of labor which is used in a certain time period. Amount of labor and amount of capital are sig

Perfectly competitive firm, Explain why a perfectly competitive firm does n...

Explain why a perfectly competitive firm does not expand its sales without limit if its horizontal demand curve indicates that it can sell as much as desires at the current market

What do you mean by yield curve, Q. What do you mean by yield curve? Yi...

Q. What do you mean by yield curve? Yield curve is a graph of interest rates of different maturity (recalculated to yearly rates) at a specific point in time. It's common for t

Write Your Message!

Captcha
Free Assignment Quote

Assured A++ Grade

Get guaranteed satisfaction & time on delivery in every assignment order you paid with us! We ensure premium quality solution document along with free turntin report!

All rights reserved! Copyrights ©2019-2020 ExpertsMind IT Educational Pvt Ltd