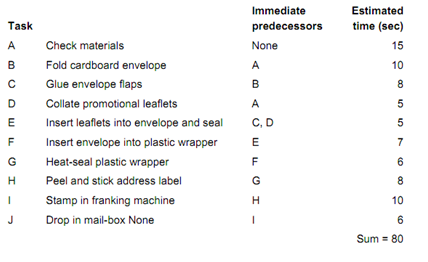
Tasks, Predecessors and Times - Process Design
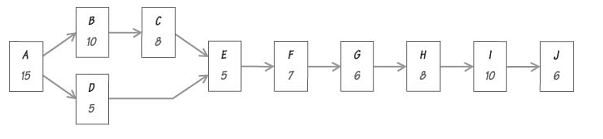
The first step in the procedure is to draw a precedence diagram, shown here, the task labels and times entered in the nodes.
The next step is to determine the cycle time required to deliver the stipulated rate of output:
Time cycle = productive time available per hour / output per hour
3600 output per hour / (8,000/5*8)) mail shots per hour = 18 seconds
We then calculate the theoretical minimum number of workstations required. This would be the result if it were possible to design the line such that the task times were evenly spread among the workstations; a very unlikely outcome in practice. However, as we will see later, it can be used to assess the utilisation of the practicable line layout produced by the procedure.
Theoretical minimum number of workstation = Sum of task times/cycle times = 80/18
=4.4 workstations
The next stage, the allocation of tasks to workstations, is usually conducted by heuristic (ie rule-of-thumb) methods. There are several such heuristics; we will use one of the simpler ones, the longest-task- time heuristic, the results of its application being displayed in the table below. It begins with the first workstation and consideration of the candidate tasks that could be allocated to it. In this case there is only one candidate, 'A', since no other task can begin until 'A' is complete. 'A' is allocated, its time entered, and the remaining unassigned part of the 18-second cycle time calculated and entered (18 - 15 = 3 seconds).