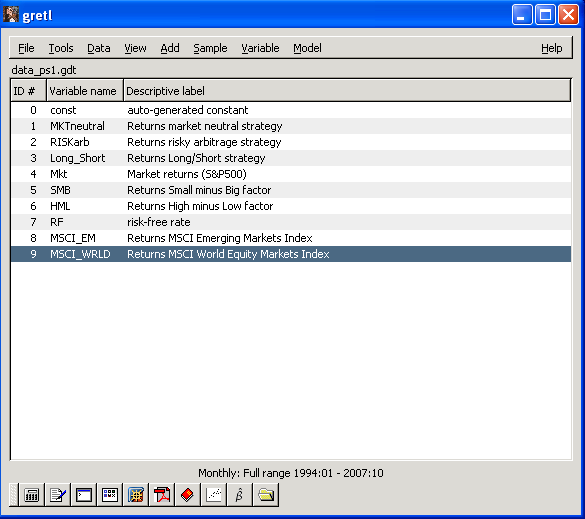
In this problem set we are going to analyze returns of indices for three hedge funds strategies (market neutral, risky arbitrage, long/short). The indices are constructed by CSFB/Tremont.
In addition to the three HF strategies, we have time series for the market return, SMB, HML, and returns on the MSCI emerging and world markets returns.
Answer the following questions:
1. Find some information about these strategies on the internet and provide a short description of the similarities/differences in their investment styles.
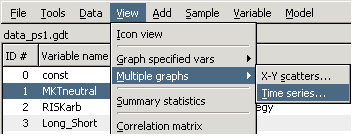
2. Make a time series plot of the strategies returns (variables MKTneutral, RISKarb, and Long_short) and the market (Mkt) following the menus indicated on the right-picture (then select the variables on the left, click select and then OK). Click on the graph and copy/paste to a word document. Provide some thoughts on the behavior of the different time series, discussing the range of variation of the returns, the presence of extreme events (by the way, the returns are in %). Do you "visually" catch any significant difference in the time series properties of HF returns?
3. Scatter plot each of the three HF returns against the market (menu View -> Graph Specified Vars -> X-Y Scatter). On the window that appears, select the market return for the X-axis and one of the three HF returns for the Y-axis. Click OK. Copy/Paste the graph and do it for the other two HF returns as well. The line across the points indicates the regression line (more on what it means next week).
Discuss what you learn about HF returns (compared to the market return) by looking at these scatter plots, if you think there is correlation between HF and market return (positive/negative? strong/weak?). Which among the three HF returns looks like having highest correlation with the market?
4. On the list of variables, select the three HF returns and the market; then, go to menu View and Summary Statistics. On the window that appears are reported mean, standard deviation, skewness and excess (over 3) kurtosis for the four variables. Copy/paste the table in your Word document.
Discuss the differences among the 4 assets in terms of expected return (remember that the returns are monthly), standard deviation, skewness and kurtosis. Based on estimates for skewness and kurtosis, do you suspect that the returns might have a non-normal distribution?
5. Based on the results in (4), test the null hypothesis that the HF and market returns have mean equal to zero against the alternative that they are positive. Clearly state the null hypothesis, test statistic, the distribution of the test statistic, and your decision to reject or not the null hypothesis. Use a 5% significance level.
6. Test also the null hypothesis that the mean of the Long/Short strategy return and the market return is equal against the alternative that they are different. Clearly state the null hypothesis, test statistic, the distribution of the test statistic, and your decision to reject or not the null hypothesis. Use a 1% significance level.
7. As in point (3), select the 4 variables we are considering and, in menu View, select Correlation Matrix. Again, copy/paste the results. Discuss the magnitude and sign of the sample correlations. Do they support the "graphical" discussion in point (2)?
8. Select one of the HF returns. Go to the menu Variable, then Frequency Plot and Against Normal
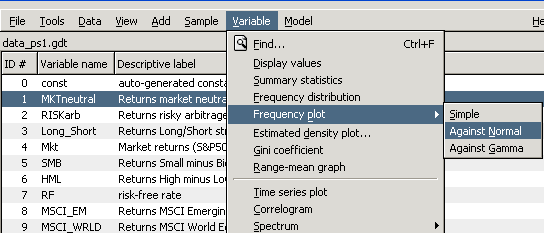
What we are doing is to plot an histogram of the variables and the estimated normal density (given the sample mean and variance). Do the same for the other 2 HF returns. Discuss whether the histogram suggests that the HF returns are approximately normal; in particular, pay attention to the tails of the distribution and the center of the distribution (the top-right corner of the graph reports the mean and variance of the series).