Standard Deviation - Statistical Aspects of Variability
Although the range gives an indication of variability, its value is solely determined by two measurements, the largest and the smallest. A better indication of variability, which takes into account all of the measurements, is the standard deviation.
At first sight the following expression might seem to be appropriate.
f1(x1- µ) +f2(x2- µ) +f3(x3- µ) +... / N
Since we're looking for a measure of dispersion about the mean, then the simple one shown above seems to fit the bill, since, by multiplying the class frequency by the 'distance' of the mid-class value from the mean, and dividing by the number of measurements, it finds the average dispersion of the measurements.
However, because µis the arithmetical mean, some of the difference values will be positive and the others will be negative. When they are added algebraically the result will be close to zero, giving no indication of the variability.
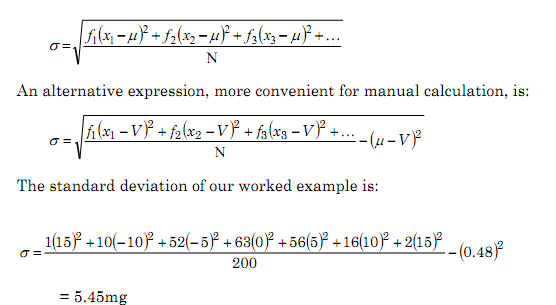
This problem can be overcome by squaring the difference terms, the resulting value being termed the variance. The most commonly used statistical measure of variability, the standard deviation (σ, sigma), is calculated as the square root of the variance.
