Solve lpp question graphically, Operation Research

Assignment Help:

A producer of furniture manufactures two products - tables and chairs. Processing of these products is done on two machines A and B. A chair needs 2 hours on machine A and 6 hours on machine B. A table needs 5 hours on machine A and no time on machine B. There are 16 hours of time per day accessible on machine A and 30 hours on machine B. Profit earned by the manufacturer from a chair and a table is Rs 2 and Rs 10 correspondingly. What must be the everyday production of each of two products?

Answer

Assume x1 indicates the number of chairs

Assume x2 indicates the number of tables


Chairs

Tables

Availability

Machine A

Machine B

2

6

5

0

16

30

Profit

Rs 2

Rs 10


LPP

Max Z = 2x1 + 10x2

Subject to

2x1+ 5x2 ≤ 16

            6x1 + 0x2 ≤ 30

 x1 ≥ 0 , x2 ≥ 0 


Solve graphically

The first constraint 2x1+ 5x2 ≤ 16, can be written in the form of equation

2x1+ 5x2 = 16

Place x1 = 0, then x2 = 16/5 = 3.2

Place x2 = 0, then x1 = 8

The coordinates are (0, 3.2) and (8, 0)

The second constraint 6x1 + 0x2 ≤ 30, can be written in the form of equation

6x1 = 30 → x1 =5

764_LPP Problems Solved Graphically.png

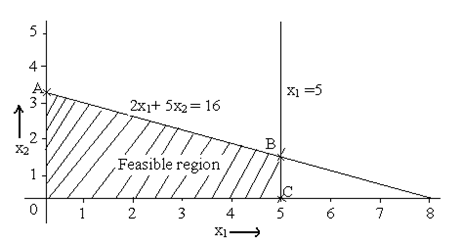
The corner positions of feasible region are A, B and C. So the coordinates for the corner positions are

A (0, 3.2)

B (5, 1.2) (Solve the two equations 2x1+ 5x2 = 16 and x1 =5 to obtain the coordinates)

C (5, 0)


We are given that Max Z = 2x1 + 10x2

At A (0, 3.2)

Z = 2(0) + 10(3.2) = 32


At B (5, 1.2)

Z = 2(5) + 10(1.2) = 22


At C (5, 0)

Z = 2(5) + 10(0) = 10


Max Z = 32 and x1 = 0, x2 = 3.2

The manufacturer must manufacture about 3 tables and no chairs to obtain the max profit.


Related Discussions:- Solve lpp question graphically

Linear programming problem, A paper mill produces two grades of paper viz.,...

A paper mill produces two grades of paper viz., X and Y. Because of raw material restrictions, it cannot produce more than 400 tons of grade X paper and 300 tons of grade Y paper i

Frequency distribution graphs, Frequency  Distribution Graphs Freq...

Frequency  Distribution Graphs Frequency distribution graphs may be histogram frequency  polygon  frequency  curve  ogive curve.   1. Histogram The histogram is draw  f

Operation research, different classification of models in operation researc...

different classification of models in operation research

Least cost method of transportation model, how do you calculate using this ...

how do you calculate using this method where the least cost appears twice

Replacement theory.., a pipe lis dur for rpair,the repair would cost 10000 ...

a pipe lis dur for rpair,the repair would cost 10000 and it would last for 3 years.alternatively a new pipe line can be purchase at 30000 for 10 years.assuming 10% depriciation rat

Explain the competitive environment of a company, 1) Provide an overall des...

1) Provide an overall description of the business and the competitive environment in which it operates.  You should describe: a) what type of business it  is (e.g. retail, manuf

Production and operations management., layout of any retailer shop and the ...

layout of any retailer shop and the reasons for the layout

Determining sample size for estimating means-sample decisons, Determining S...

Determining Sample Size for estimatingMeans a. Acceptable Errors: There  may be several errors  in the  sample  size. The researcher  will have  to decide those  errors. Whic

Yates correction for continuity for 2x 2tables , Yates Correction for Cont...

Yates Correction for Continuity for  2x 2Tables If any cell frequency in  2x 2 table isles  than 5thenfor the application of X 2 test it  is pooled with the preceding or suc

Write Your Message!

Captcha
Free Assignment Quote

Assured A++ Grade

Get guaranteed satisfaction & time on delivery in every assignment order you paid with us! We ensure premium quality solution document along with free turntin report!

All rights reserved! Copyrights ©2019-2020 ExpertsMind IT Educational Pvt Ltd